Photo: Wikipedia user Coolcaesar
Real estate investment trusts, or REITs, can be an excellent way to get both growth and income in your portfolio. One area of real estate that has delivered particularly strong performance to REIT investors over the past few decades is retail. Let's take a look at two excellent, but different, retail REITs that are leaders in their respective specializations: Realty Income Corporation (O +1.36%) and Simon Property Group (SPG +0.41%).
About the contenders
As I mentioned, both of these companies focus on retail properties, but their portfolios are rather different.
Realty Income was founded in 1969, and issued its IPO in 1994. The company specializes in freestanding retail properties (think Walgreens or Dollar General -- two of the REIT's biggest tenants), and owns about 4,400 properties in 49 states and Puerto Rico. The REIT leases its properties to 235 tenants that operate in 47 different industries.
On the other hand, Simon Property Group went public in 1993 and operates large-scale shopping malls. If you live in the United States, chances are you're at least familiar with one of Simon's "Premium Outlets" or "The Mills" properties. In total, the company owns 228 properties with approximately 188.6 million rentable square feet, occupied by more than 3,100 tenants.
Don't let the difference in property count (228 vs. 4,400) throw you off -- Simon is several times larger than Realty Income, and is actually the largest public REIT of any type.
But isn't retail risky?
If you're hesitant to invest in anything having to do with retail, it's certainly understandable. After all, there have been several high-profile retail bankruptcies in recent years, and many other retailers are struggling to survive. However, both of these REITs do a good job of reducing risk.
In Realty Income's case, most of the properties fall into one of three specific categories, which are not vulnerable to online competition like most of the retailers that are struggling.
- Businesses that provide a service, such as health clubs, movie theaters, and fast food restaurants.
- Businesses that specialize in non-discretionary goods, such as gas stations, convenience stores, and drug stores.
- Businesses that sell items at a low price point, like dollar stores.
In short, these are all businesses that people have to physically go to. Because of this, there is minimal threat from online competition and minimal turnover since these businesses are reliant on their physical locations -- after all, how often does a fast food restaurant just pack up and move to a different location? This is the primary reason why Realty Income has maintained an excellent occupancy level, which has never fallen below 96% no matter what the economy is doing.

Source: Realty Income Corp.
Simon Property Group does indeed have some exposure to businesses that are vulnerable to competition from online retailers, and that specialize in discretionary goods. However, the company is so large and diverse that a few retailers shutting down wouldn't be a big deal.
No single tenant represents more than 3.5% of the company's income, and there are more than 3,100 individual tenants altogether. And, Simon does an excellent job at maintaining desirable properties, with modern shopping conveniences such as free wi-fi, phone charging stations, play areas for kids, and valet parking, which helps keep its malls full and retailers happy.
For these reasons, both of these REITs have investment-grade credit ratings. Realty Income has a BBB+/Baa1 rating from S&P and Moody's, respectively, and Simon has an even more impressive A/A2 rating.
Another aspect of retail real estate that helps to reduce risk is the favorable lease structure. Retail properties are generally leased for long periods of time, and on a "net lease" basis, which means that the tenants take care of the variable costs of owning a property such as taxes, maintenance, and insurance. In fact, Realty Income's average lease is signed with a 17.5 year term, with annual rent increases built in.
Growth strategies
Realty Income's growth strategy essentially consists of acquisitions. The company actively seeks out freestanding properties occupied by desirable tenants in premium locations. In fact, so far in 2015, Realty Income has added $1.1 billion in acquired properties to its portfolio.
Simon, on the other hand, is all about development. Its main objective is to develop new properties, and continually enhance its existing ones to ensure that they remain the premier destinations for shoppers. As I alluded to before, Simon's goal is to create the best retail environments in the marketplace.
Capital structure
Both companies do a pretty good job of operating without too much debt, with a slight edge to Simon Property Group.
Realty Income's debt makes up 32.8% of its total capitalization, and the company has a fixed-charge coverage of 3.8 to one. In other words, for every dollar needed to make its debt payments and fulfill its obligations to preferred shareholders, it earns $3.80.
Simon has a slightly lower 30.6% debt-to-capitalization ratio, and a slightly more appealing 4.1-to-one fixed charge coverage.
So, Simon has an advantage here, but it is pretty close, and both companies have attractive balance sheets. Plus, with investment-grade credit ratings, both companies have plentiful access to capital to take advantage of opportunities that arise.
Performance history and dividends
Before we get into this, it's important to mention that an investment's past performance doesn't guarantee its future results. Even companies with a flawless dividend history that outperform the market consistently are not completely immune to adverse conditions. However, a strong history makes it more likely that the investment will continue to do well.
Having said that, both of these companies have delivered performance that would make most investors jealous.
Realty Income pays an impressive 4.5% dividend yield, and makes payments on a monthly, not quarterly, basis. The company has increased its dividend for 72 consecutive quarters, at an average annual growth rate of 5%. In other words, not only do you get a solid income stream, but it should grow fast enough to keep up with inflation and more.
Simon Property Group has also done a good job of increasing dividends, although its annual yield is lower at 3.1%.
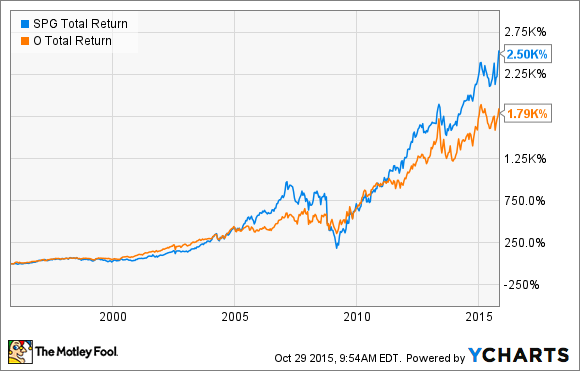
However, long-term investing is about total return, which includes dividends as well as share price growth. And, both of these companies have done well, with average annual returns of 16.4% (Realty Income) and 16.1% (Simon) since they went public in 1994 and 1993, respectively. To put this kind of performance in perspective, consider that a $10,000 investment in both companies 20 years ago (October 1995) would be worth nearly $430,000 today.
Valuation
When valuing REITs, it's important to focus on funds from operations (FFO) as opposed to EPS, which doesn't provide an accurate picture of the money these companies actually make. Adjusted FFO, or AFFO, is an even more accurate measure of REITs' ability to pay dividends since it accounts for one-time charges among other factors, but the calculation for this metric isn't universal so we'll focus on FFO for an apples-to-apples comparison.
Realty Income just reported third quarter FFO of $0.69 per share, and issued full-year guidance in the range of $2.72 to $2.77 per share. Simon Property Group produced FFO of $2.54 per share, and full-year guidance of $10.10 to $10.15. So, here's how the valuation metrics stack up side by side.
|
Company |
Share price (10/28/15) |
2015 FFO Guidance |
Midpoint of guidance |
Price/FFO multiple |
|---|---|---|---|---|
|
Realty Income |
$50.60 |
$2.72-$2.77 |
$2.745 |
18.4 |
|
Simon Property Group |
$205.71 |
$10.10-$10.15 |
$10.125 |
20.3 |
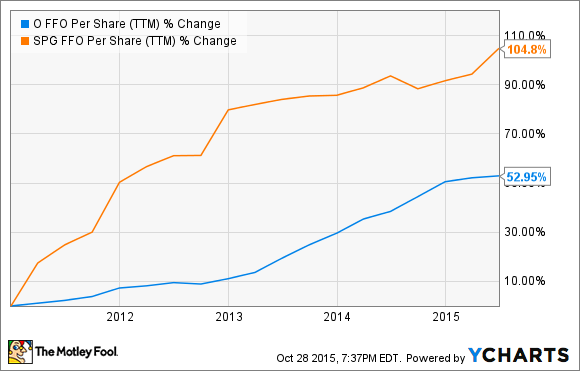
As you can see, Simon Property Group trades at a premium, but there are some good reasons for this. First of all, the company's higher credit rating, access to capital, and overall financial stability deserve some consideration. Also, Simon Property Group has delivered stronger FFO growth than Realty Income in recent years, which also is worthy of a higher valuation.
The Foolish bottom line
Both of these are excellent choices, and it's tough to go wrong with either one. I tend to lean toward Realty Income, as I think their business model will prove to be a little more immune to the online-shopping trend. However, these are two fantastic REITs and either one (or both) would make an excellent addition to an income investor's portfolio.