On May 23, Target Corporation (NYSE:TGT) released first-quarter earnings for the period ended May 5.
- The continued success of Target's credit-card business, designer-sponsored clothing lines, and generic drug sales helped generate a 17.5% growth in revenue.
- Leverage on selling, general, and administrative expenses -- coupled with lower cost of sales -- helped improve margins.
- Inventory was effectively managed, as it increased only 5.9%, compared to a 9% rise in total sales.
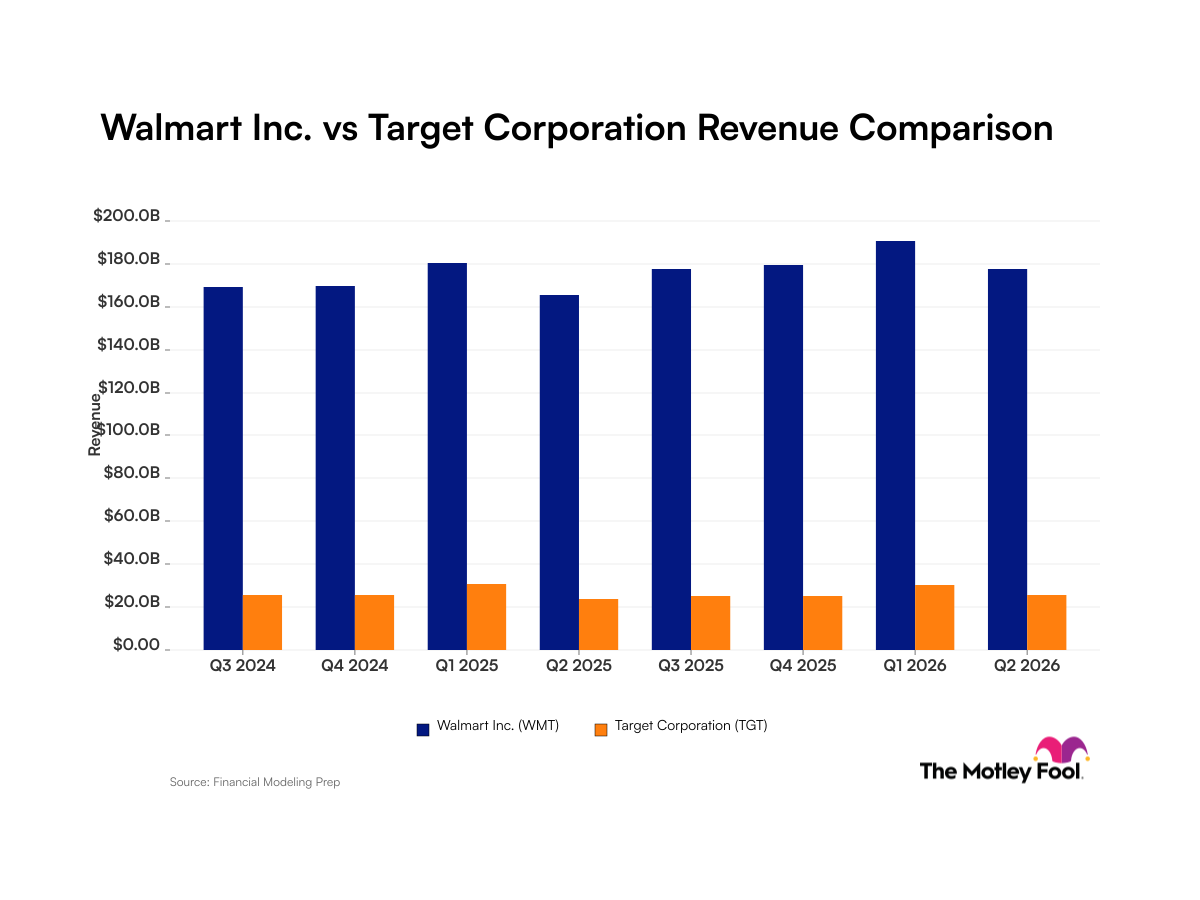
- While competitor Wal-Mart (NYSE:WMT) still rules the discount retailing world, investors in the Motley Fool CAPS online community seem more bullish about Target; they offer the company a rating of four stars out of five. Meanwhile, Wal-Mart only earns two stars.
(Figures in millions, except per-share data.)
Income Statement Highlights
|
Q1 2007 |
Q1 2006 |
Change | |
|---|---|---|---|
|
Sales |
$14,041.0 |
$12,863.0 |
9.2% |
|
Net Profit |
$651.0 |
$554.0 |
17.5% |
|
EPS |
$0.75 |
$0.63 |
19.0% |
|
Diluted Shares |
862.8 |
877.6 |
(1.7%) |
Get back to basics with the income statement.
Margin Checkup
|
Q1 2007 |
Q1 2006 |
Change* | |
|---|---|---|---|
|
Gross Margin |
34.6% |
34.1% |
0.5 |
|
Operating Margin |
8.6% |
7.9% |
0.6 |
|
Net Margin |
4.6% |
4.3% |
0.3 |
Margins are the earnings engine.
Balance Sheet Highlights
|
Assets |
Q1 2007 |
Q1 2006 |
Change |
|---|---|---|---|
|
Cash + ST Invest. |
$969.0 |
$989.0 |
(2.0%) |
|
Accounts Rec. |
$6,006.0 |
$5,368.0 |
11.9% |
|
Inventory |
$6,387.0 |
$6,030.0 |
5.9% |
|
Liabilities |
Q1 2007 |
Q1 2006 |
Change |
|---|---|---|---|
|
Accounts Payable |
$5,877.0 |
$5,707.0 |
3.0% |
|
Long-Term Debt |
$10,151.0 |
$8,596.0 |
18.1% |
The balance sheet reflects the company's health.
Cash Flow Highlights
|
Q1 2007 |
Q1 2006 |
Change | |
|---|---|---|---|
|
Cash From Ops. |
$462.0 |
$527.0 |
(12.3%) |
|
Capital Expenditures |
$1,183.0 |
$884.0 |
33.8% |
|
Free Cash Flow |
($721.0) |
($357.0) |
N/A |
Free cash flow is a Fool's best friend.
Related Foolishness:
Wal-Mart is a Motley Fool Inside Value recommendation. Want to find out which inexpensively priced moneymaking machines Inside Value subscribers are snapping up today? Click here to be our guest for the next 30 days.
Fool by Numbers is designed to give you the raw earnings information in a timely fashion, putting all the numbers you need in one easy-to-read place. But at The Motley Fool, we believe numbers tell only part of the story, so check Fool.com for more of our in-depth discussion of what the numbers mean. This data has been provided by Netscribes. To provide feedback on this article, please click on the "feedback" button below.