Although headlines still spray earnings figures all over the media every day, many investors have moved past net earnings as a measure of a company's economic output. That's because earnings are very often less trustworthy than cash flow, since earnings are more open to manipulation based on dubious judgment calls.
Earnings' unreliability is one of the reasons Foolish investors often flip straight past the income statement to eyeball the cash flow statement. In general, by taking a close look at the cash moving in and out of the business, you can better understand whether the last batch of earnings brought money into the company, or merely disguised a cash gusher with a pretty headline.
Calling all cash flows
It's worth checking up on your companies' free cash flow once a quarter or so, to see whether it bears any relationship to the net income in the headlines. That brings us to Microsoft (Nasdaq: MSFT), which has produced $22,096 million in FCF over the trailing 12 months, compared to $18,760 million in net income.

That means that Microsoft turned 35% of its revenues into FCF. That looks amazing. But, it always pays to compare that figure to sector and industry peers and competitors, to see how your company stacks up.
|
Company |
LTM Revenue |
TTM FCF |
TTM FCF Margin |
|---|---|---|---|
|
Google (Nasdaq: GOOG) |
$26,214 |
$9,003 |
34% |
|
Oracle (Nasdaq: ORCL) |
$26,820 |
$8,451 |
32% |
|
Adobe Systems (Nasdaq: ADBE) |
$3,257 |
$833 |
26% |
|
Apple (Nasdaq: AAPL) |
$57,089 |
$14,318 |
25% |
|
Activision Blizzard (Nasdaq: ATVI) |
$4,606 |
$1,012 |
22% |
|
International Business Machines (NYSE: IBM) |
$97,379 |
$16,120 |
17% |
Among its competitors and peers, Google comes in with the highest FCF margin (defined as FCF / trailing 12 months' revenue), with 34% of its revenues turning into FCF. Microsoft tops all its big tech competitors, from search specialist to database-driven Oracle, designer Adobe, up-and-coming Apple, gamer Activision Blizzard, and ancient International Business Machines.
All cash is not equal
Unfortunately, the cash flow statement isn't immune from nonsense, either. That's why it pays to take a close look at the components of cash flow from operations, to make sure that the cash comes from high-quality sources. They need to be real and replicable in the upcoming quarters, rather than being offset by continual cash outflows that don't appear on the income statement (such as major capital expenditures). For instance, cash flow based on cash net income and adjustments for non-cash income-statement expenses (like depreciation) is generally favorable. An increase in cash flow based on stiffing your suppliers (by increasing accounts payable) or shortchanging Uncle Sam on taxes will come back to bite investors later. The same goes for decreasing accounts receivable; this is good to see, but it's ordinary in recessionary times, and you can only increase collections so much.
So, how does the cash flow at Microsoft look? Take a peek at the chart below, which flags questionable cash flow sources with a red bar.
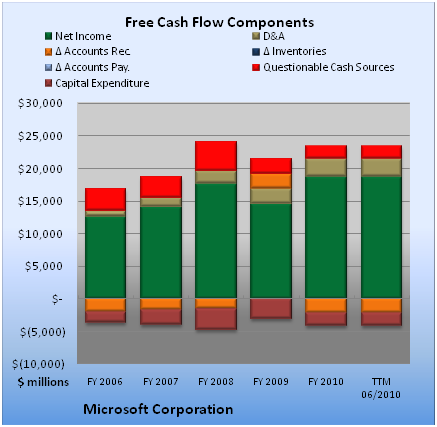
When I say "questionable cash flow sources," I mean line items such as changes in taxes payable, tax benefits from stock options, and asset sales, among others. That's not to say that companies booking these as sources of cash flow are weak, or are engaging in any sort of wrongdoing, or that everything that comes up questionable in my graph is automatically bad news. But whenever a company is getting more than, say, 10% of its cash from operations from these dubious sources, I feel obliged to crack open the filings and dig even deeper, to make sure I'm in touch with its true cash profitability.
With questionable cash sources comprising 8% of the cash flow from operations for Microsoft, I'm not too worried, but it would be a good idea to keep an eye on this in the future.
A Foolish final thought
If you take the time to read past the headlines and crack a filing now and then, you're probably ahead of 95% of the market's individual investors. By keeping an eye on the health of your companies' cash flow, you can spot potential trouble early, or figure out whether the numbers merit Mr. Market's pessimism. Let us know what you think of the health of the cash flows at Microsoft in the comments box below. Or, if you're itching to learn more, head on over to our quotes page to view the filings directly.