Accessibility Menu
Carvana logo

Carvana(NYSE) CVNA

Market Cap$46.79BMarket cap calculated using publicly traded shares outstanding only. Does not include unlisted, private, or dual-class non-traded shares. Implied market cap may vary.
Since IPO (2017)+3,057%
5 Year-0%
1 Year+0%
1 Month+4%
$64.86
-7.47%
-5.24Today
After hours$65.37+$0.51 (+0.79%)
Carvana last closing stock price
MetricPriceDate
Last closeUSD 70.092026-08-17
Carvana stock price return by period
PeriodPrice returnPrice at period startPeriod start date
1 week-5.49%USD 74.162026-08-10
1 month+4.08%USD 67.342026-07-17
3 month+10.64%USD 63.352026-05-19
Year to date-16.96%USD 84.402025-12-31
1 year+0.13%USD 70.002025-08-15
3 year+793.78%USD 7.842023-08-18
5 year-0.06%USD 70.132021-08-18
Since inception+3,057.21%USD 2.222017-04-28

Carvana Financials at a Glance

Market Cap

$46.79BMarket cap calculated using publicly traded shares outstanding only. Does not include unlisted, private, or dual-class non-traded shares. Implied market cap may vary.

Revenue (TTM)

$25.06B

Net Income (TTM)

$1.57B

EPS (TTM)

$2.16

P/E Ratio

30.15

Dividend

$0.00

Beta (Volatility)

2.88 (High)

Price

$64.86

Volume

16,880,014

Open

$67.62

Previous Close

$65.00

Daily Range

$64.76 - $69.00

52-Week Range

$54.46 - $97.38

Estimated Earnings Date

Oct 28, 2026

CVNA: Motley Fool Moneyball Superscore

71

Our CEO Is Handing Members His Secret Weapon

It's called Motley Fool Moneyball, our new proprietary AI tool

We spent over half a million dollars in R&D to build a tool that makes stock research faster, sharper, and smarter. Our analysts use it every day, and now, you can too.

Get Access Now

About Carvana

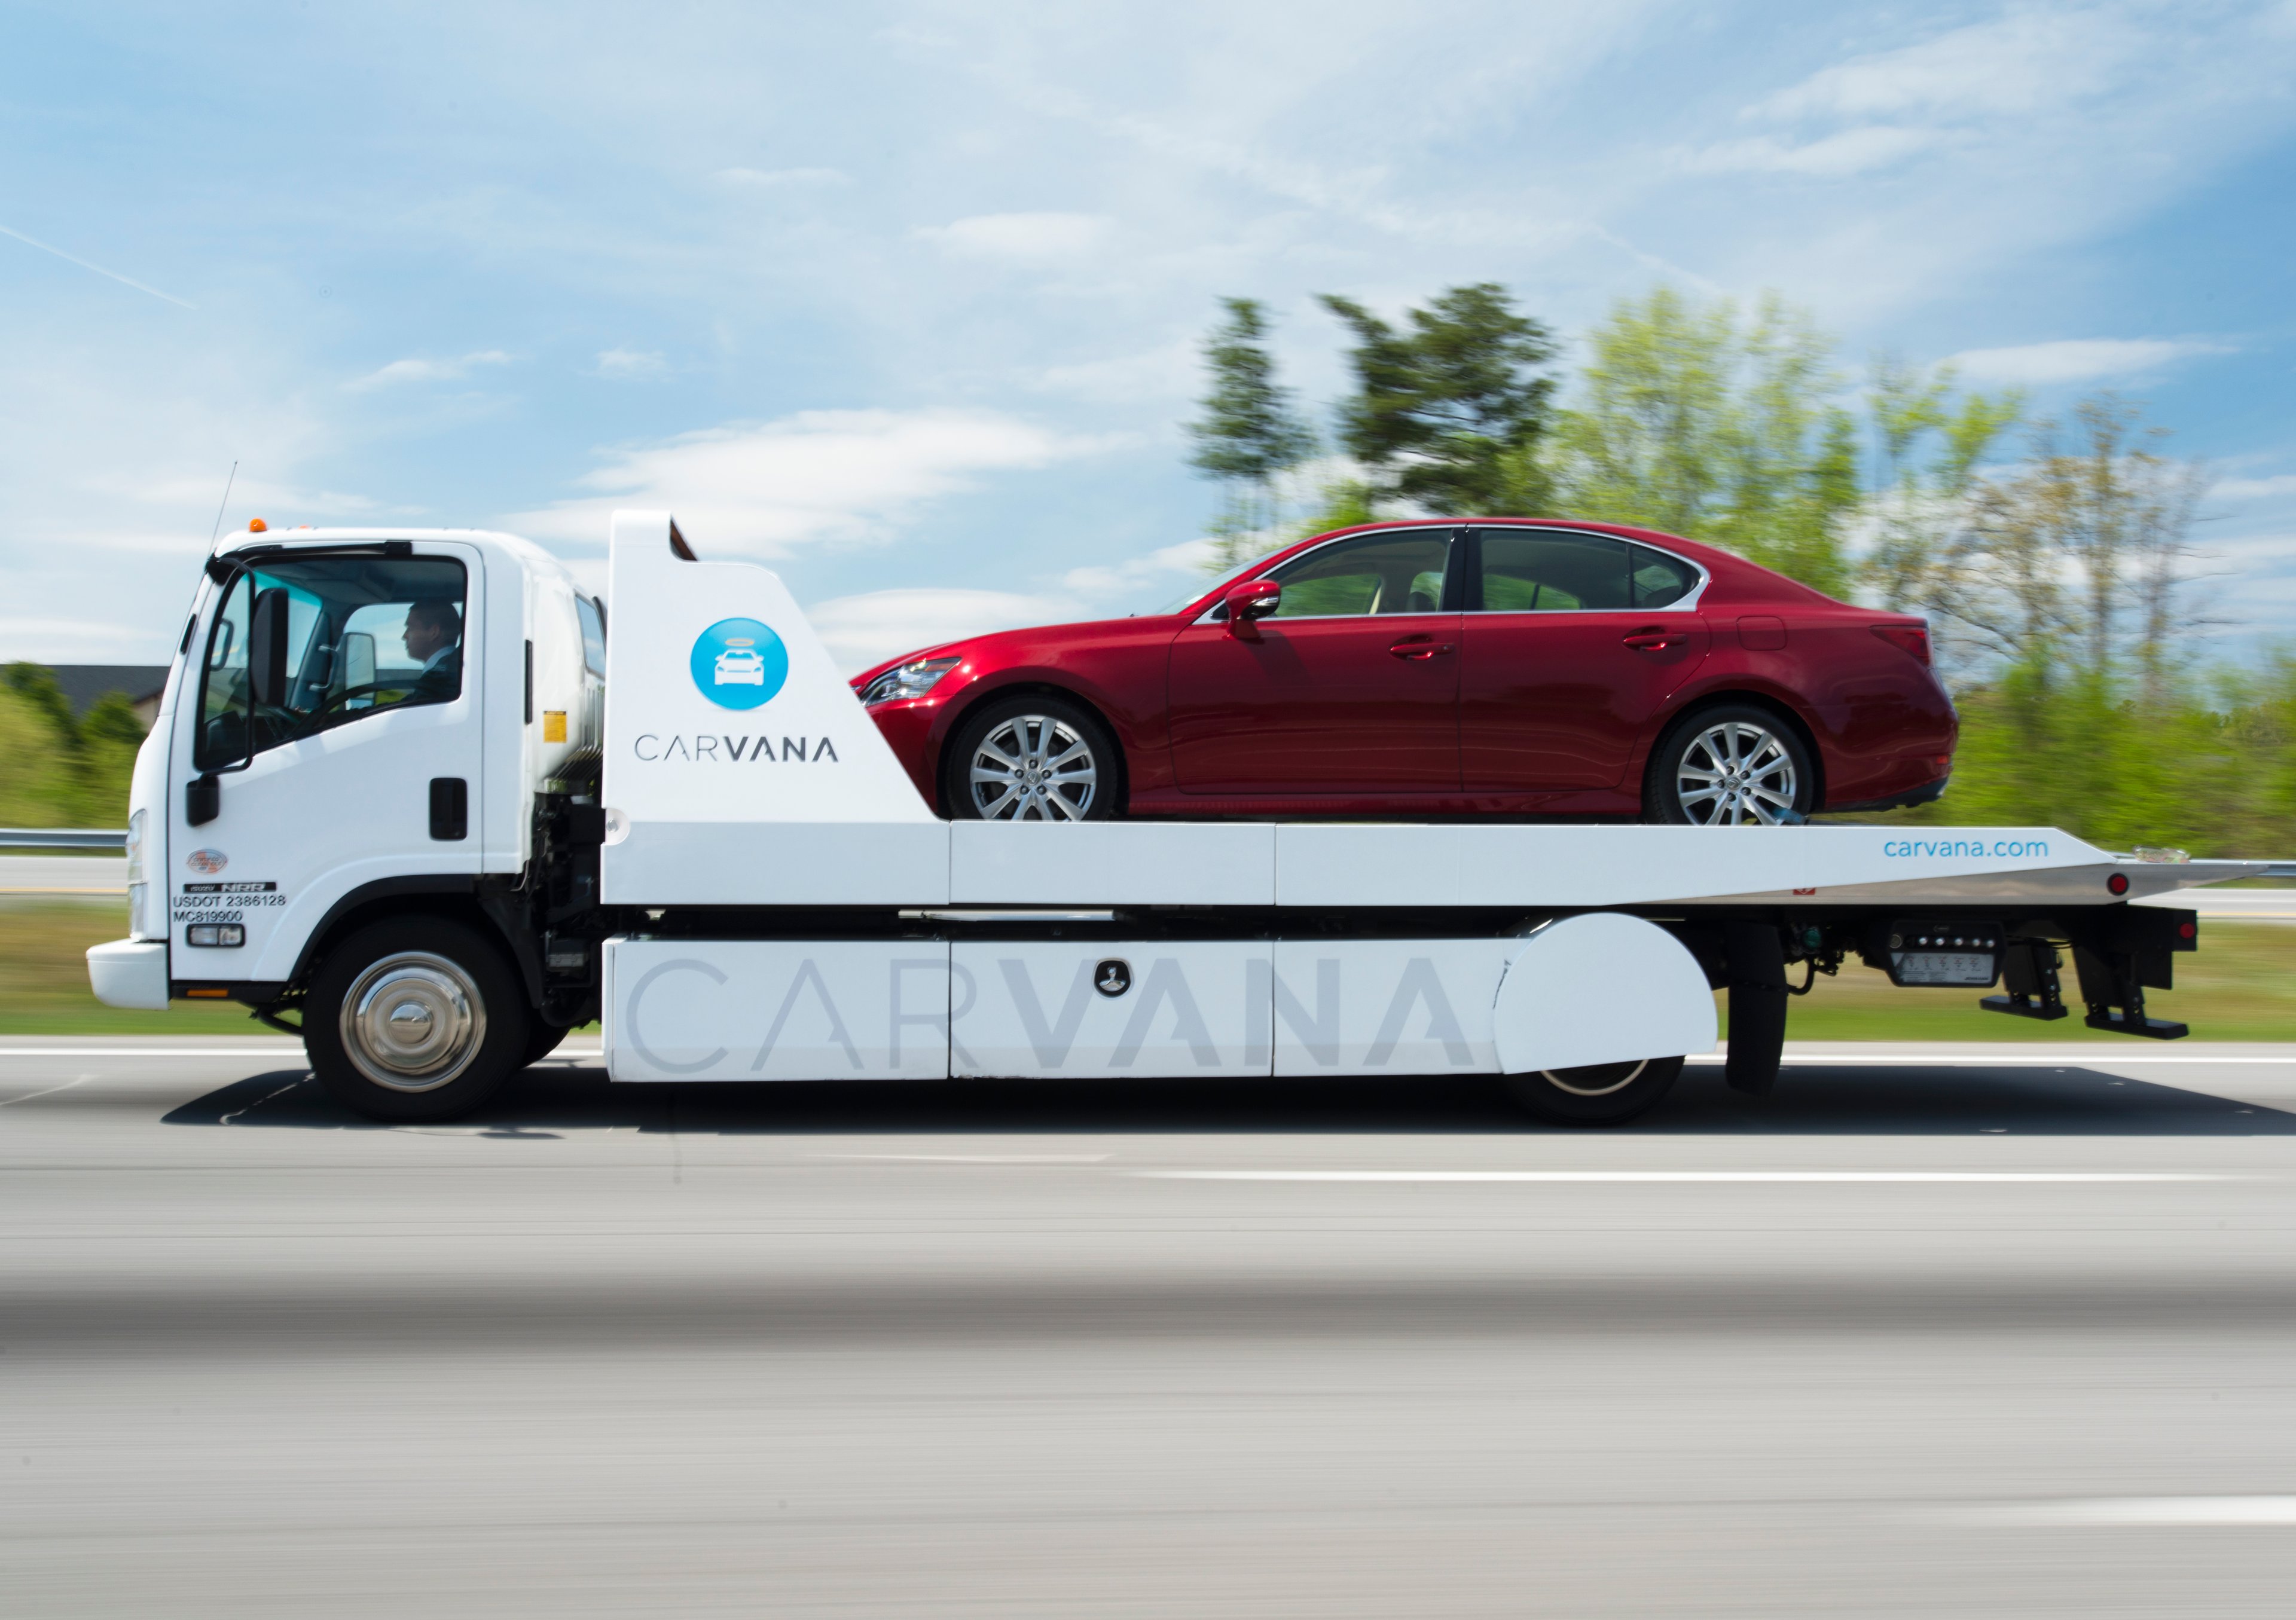
Carvana Co. helps people buy and sell used cars online. Customers can choose from thousands of vehicles on a website or app. The company delivers cars to homes or offers pickup at vending machines.

How Carvana Makes Money

  • Retail Vehicle Sales: Used car sales to customers and related delivery fees; accounted for $5.5 billion of revenue in the three months ended June 30, 2026.
  • Wholesale Sales and Revenues: Revenue from selling vehicles to wholesalers and fees from third-party auction services; totaled $1.3 billion in the three months ended June 30, 2026.
  • Other Sales and Revenues: Gains from selling car loans and commissions on service contracts, gap insurance, and auto insurance; generated $526 million in the three months ended June 30, 2026.

Expanding the Network

  • Partnered with Root to offer an integrated auto insurance solution directly on the e-commerce platform.
  • Integrated production lines at ADESA facilities to increase the capacity for vehicle inspection and reconditioning.
  • Expanded the logistics network to reach 316 metropolitan areas and over 80% of the U.S. population as of June 30, 2026.
  • Effected a five-for-one forward stock split in May 2026 to increase the number of authorized shares.

What Makes the Platform Different

The company manages a vertically integrated supply chain that includes its own inspection centers and a proprietary hub-and-spoke logistics network. This infrastructure supports a digital-first experience featuring 360-degree virtual vehicle tours and instant financing terms for customers.

Key Financial Performance

  • Retail vehicle sales rose 61.7% year over year to $5.5 billion during the three months ended June 30, 2026.
  • Net income reached $513 million for the three months ended June 30, 2026, up from $308 million during the same period in 2025.
  • Retail units sold increased 37.7% year over year to 197,325 vehicles in the three-month period ended June 30, 2026.
  • Total gross profit per unit was $7,014 for the quarter ended June 30, 2026, a 5.5% decrease from the previous year.
  • Cash and cash equivalents totaled $2.6 billion as of June 30, 2026.

Bottom Line

Carvana has evolved from a regional digital dealer into a national automotive platform with integrated financing and logistics capabilities. Its expansion into wholesale marketplaces and insurance products has diversified its revenue beyond traditional used car sales.

AI Generated • Aug 4, 2026

Industry

Specialty Retail

Employees

23,100

CEO

Ernie C. Garcia, III

Headquarters

Tempe, AZ 85281, US

CVNA Financials

Key Financial Metrics (TTM)

Gross Margin

19.37%

Operating Margin

8.93%

Net Income Margin

6.26%

Return on Equity

46.57%

Return on Capital

20.99%

Return on Assets

10.78%

Earnings Yield

3.32%

Dividend Yield

0.00%

Payout Ratio

0.00%

Stock Overview

Market Cap

$46.79BMarket cap calculated using publicly traded shares outstanding only. Does not include unlisted, private, or dual-class non-traded shares. Implied market cap may vary.

Shares Outstanding

719.92M

Volume

16.88M

Avg. Volume

10.71M

Financials (TTM)

Gross Profit

$4.85B

Operating Income

$2.24B

EBITDA

$142.00M

Operating Cash Flow

$1.12B

Capital Expenditure

-$191.00M

Free Cash Flow

$929.00M

Cash & ST Invst.

$3.13B

Total Debt

$5.62B

Carvana Performance Analysis

Carvana annual revenue and year-over-year revenue growth by fiscal year
Fiscal yearPeriod endRevenueYoY growth
20222022-12-31USD 13,604,000,0006.2%
20232023-12-31USD 10,771,000,000-20.8%
20242024-12-31USD 13,673,000,00026.9%
20252025-12-31USD 20,322,000,00048.6%
Carvana sequential (quarter-over-quarter) revenue growth by fiscal quarter
Fiscal quarterPeriod endQoQ growth
Q32025-09-3016.7%
Q42025-12-31-0.8%
Q12026-03-3114.8%
Q22026-06-3014.7%
Carvana annual diluted earnings per share and year-over-year EPS growth by fiscal year
Fiscal yearPeriod endDiluted EPSYoY growth
20222022-12-31USD -3.15865.3%
20232023-12-31USD 0.15N/A
20242024-12-31USD 0.32112.4%
20252025-12-31USD 1.69431.9%
Carvana sequential (quarter-over-quarter) diluted earnings per share growth by fiscal quarter
Fiscal quarterPeriod endQoQ growth
Q32025-09-30-19.5%
Q42025-12-31478.6%
Q12026-03-31-71.5%
Q22026-06-3023.5%

Revenue Growth Rate

Annual and quarterly growth comparison

Earnings Per Share Growth Rate

Annual and quarterly EPS growth comparison

Quarterly Performance

Name
Q2 2026YOY CHG

Revenue

$7.38B

+52.4%

Gross Profit

$1.38B

+34.8%

Gross Margin

18.76%

N/A

Market Cap

$46.79BMarket cap calculated using publicly traded shares outstanding only. Does not include unlisted, private, or dual-class non-traded shares. Implied market cap may vary.

N/A

Market Cap/Employee

$2.03M

N/A

Employees

23,100

N/A

Net Income

$310.00M

+69.4%

EBITDA

$749.00M

+44.3%

Quarterly Fundamentals

Name
Q2 2026YOY CHG

Total Cash

$3.13B

+34.8%

Total Debt

$5.62B

-8.0%

Accounts Receivable

$1.50B

+360.9%

Inventory

$3.26B

+61.3%

Long Term Debt

$5.24B

-8.5%

Short Term Debt

$382.00M

-0.5%

Return on Assets

10.78%

N/A

Return on Invested Capital

17.88%

N/A

Free Cash Flow

$187.00M

+9450.0%

Operating Cash Flow

$238.00M

+720.7%

Other Investments to Explore

People Also Watch

Symbol / CompanyPricePrice Chg
JDJD.com, Inc.
$28.82+1.12%
CPNGCoupang, Inc.
$15.58-0.89%
SESea Limited
$116.26-2.67%
RACEFerrari N.V.
$412.44-1.12%

Trending Stocks

Symbol / CompanyPricePrice Chg
TSLLDirexion Shares ETF Trust - Direxion Daily Tsla Bull 2x ETF
$8.48-0.02%
INTCIntel
$96.69-0.07%
NOKNokia
$10.39-0.04%
NVDANvidia
$219.74-0.02%

Questions About CVNA

What is the current price of Carvana?

Carvana is trading at $65.00 per share.

What is the 52-week range for Carvana?

Over the past 52 weeks, Carvana has traded between $54.46 and $97.38.

How much debt does Carvana have?

As of the most recent reporting period, Carvana reported total debt of $5.82B.

How much cash does Carvana have on hand?

Carvana reported $2.74B in cash and cash equivalents in its most recent financial results.

What is Carvana’s dividend yield?

Carvana does not currently have a dividend yield.

Premium Investing Services

Invest better with The Motley Fool. Get stock recommendations, portfolio guidance, and more from The Motley Fool's premium services.