Accessibility Menu
FMC logo

FMC(NYSE) FMC

Market Cap$1.25BMarket cap calculated using publicly traded shares outstanding only. Does not include unlisted, private, or dual-class non-traded shares. Implied market cap may vary.
Since IPO (1968)+3,532%
5 Year-89%
1 Year-75%
1 Month-13%
$11.82
+18.03%
+1.81Today
FMC last closing stock price
MetricPriceDate
Last closeUSD 10.012026-07-29
FMC stock price return by period
PeriodPrice returnPrice at period startPeriod start date
1 week-15.03%USD 11.782026-07-22
1 month-12.65%USD 11.462026-06-29
3 month-34.46%USD 15.272026-04-30
Year to date-26.98%USD 13.712025-12-31
1 year-75.36%USD 40.632025-07-29
3 year-88.28%USD 85.382023-07-28
5 year-89.02%USD 91.162021-07-30
Since inception+3,532.15%USD 0.281968-01-02

FMC Financials at a Glance

Market Cap

$1.25BMarket cap calculated using publicly traded shares outstanding only. Does not include unlisted, private, or dual-class non-traded shares. Implied market cap may vary.

Revenue (TTM)

$3.25B

Net Income (TTM)

-$2.31B

EPS (TTM)

-$20.02

P/E Ratio

-0.50

Dividend

$0.82

Beta (Volatility)

0.89 (Low)

Price

$11.82

Volume

9,908,542.15

Open

$10.50

Previous Close

$11.83

Daily Range

$10.49 - $11.85

52-Week Range

$9.95 - $42.77

Estimated Earnings Date

Nov 4, 2026

FMC: Motley Fool Moneyball Superscore

33

Our CEO Is Handing Members His Secret Weapon

It's called Motley Fool Moneyball, our new proprietary AI tool

We spent over half a million dollars in R&D to build a tool that makes stock research faster, sharper, and smarter. Our analysts use it every day, and now, you can too.

Get Access Now

About FMC

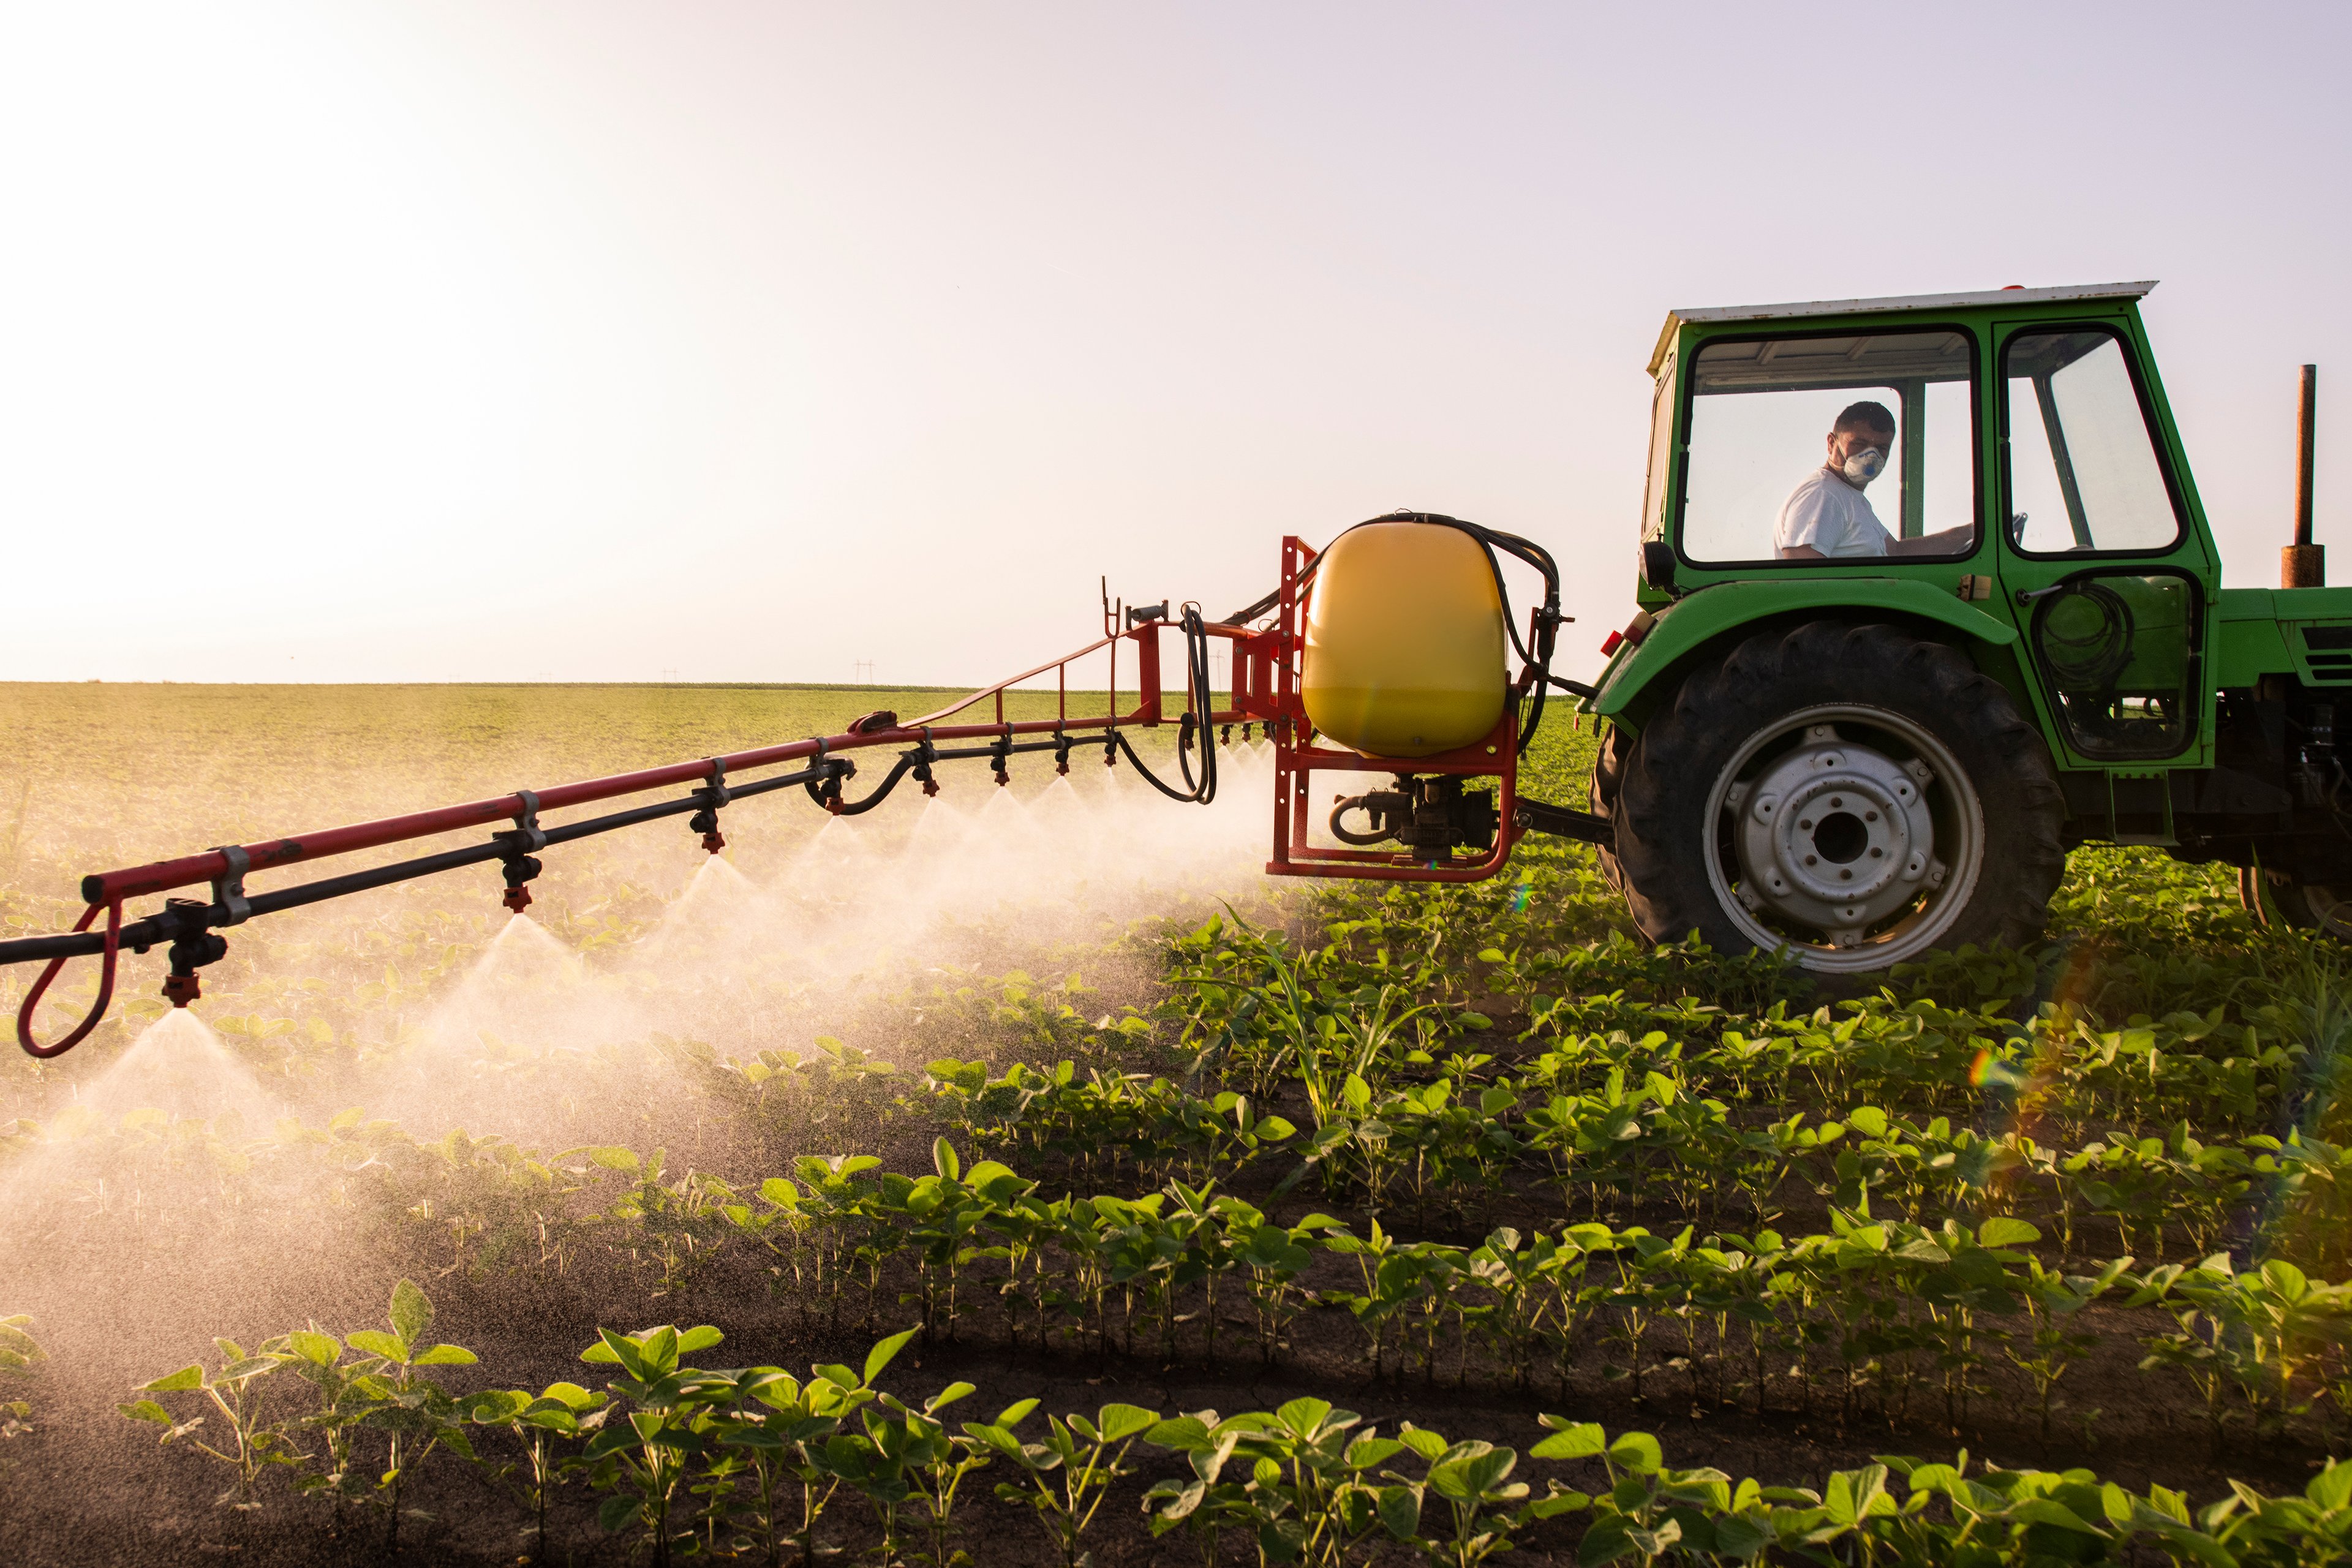
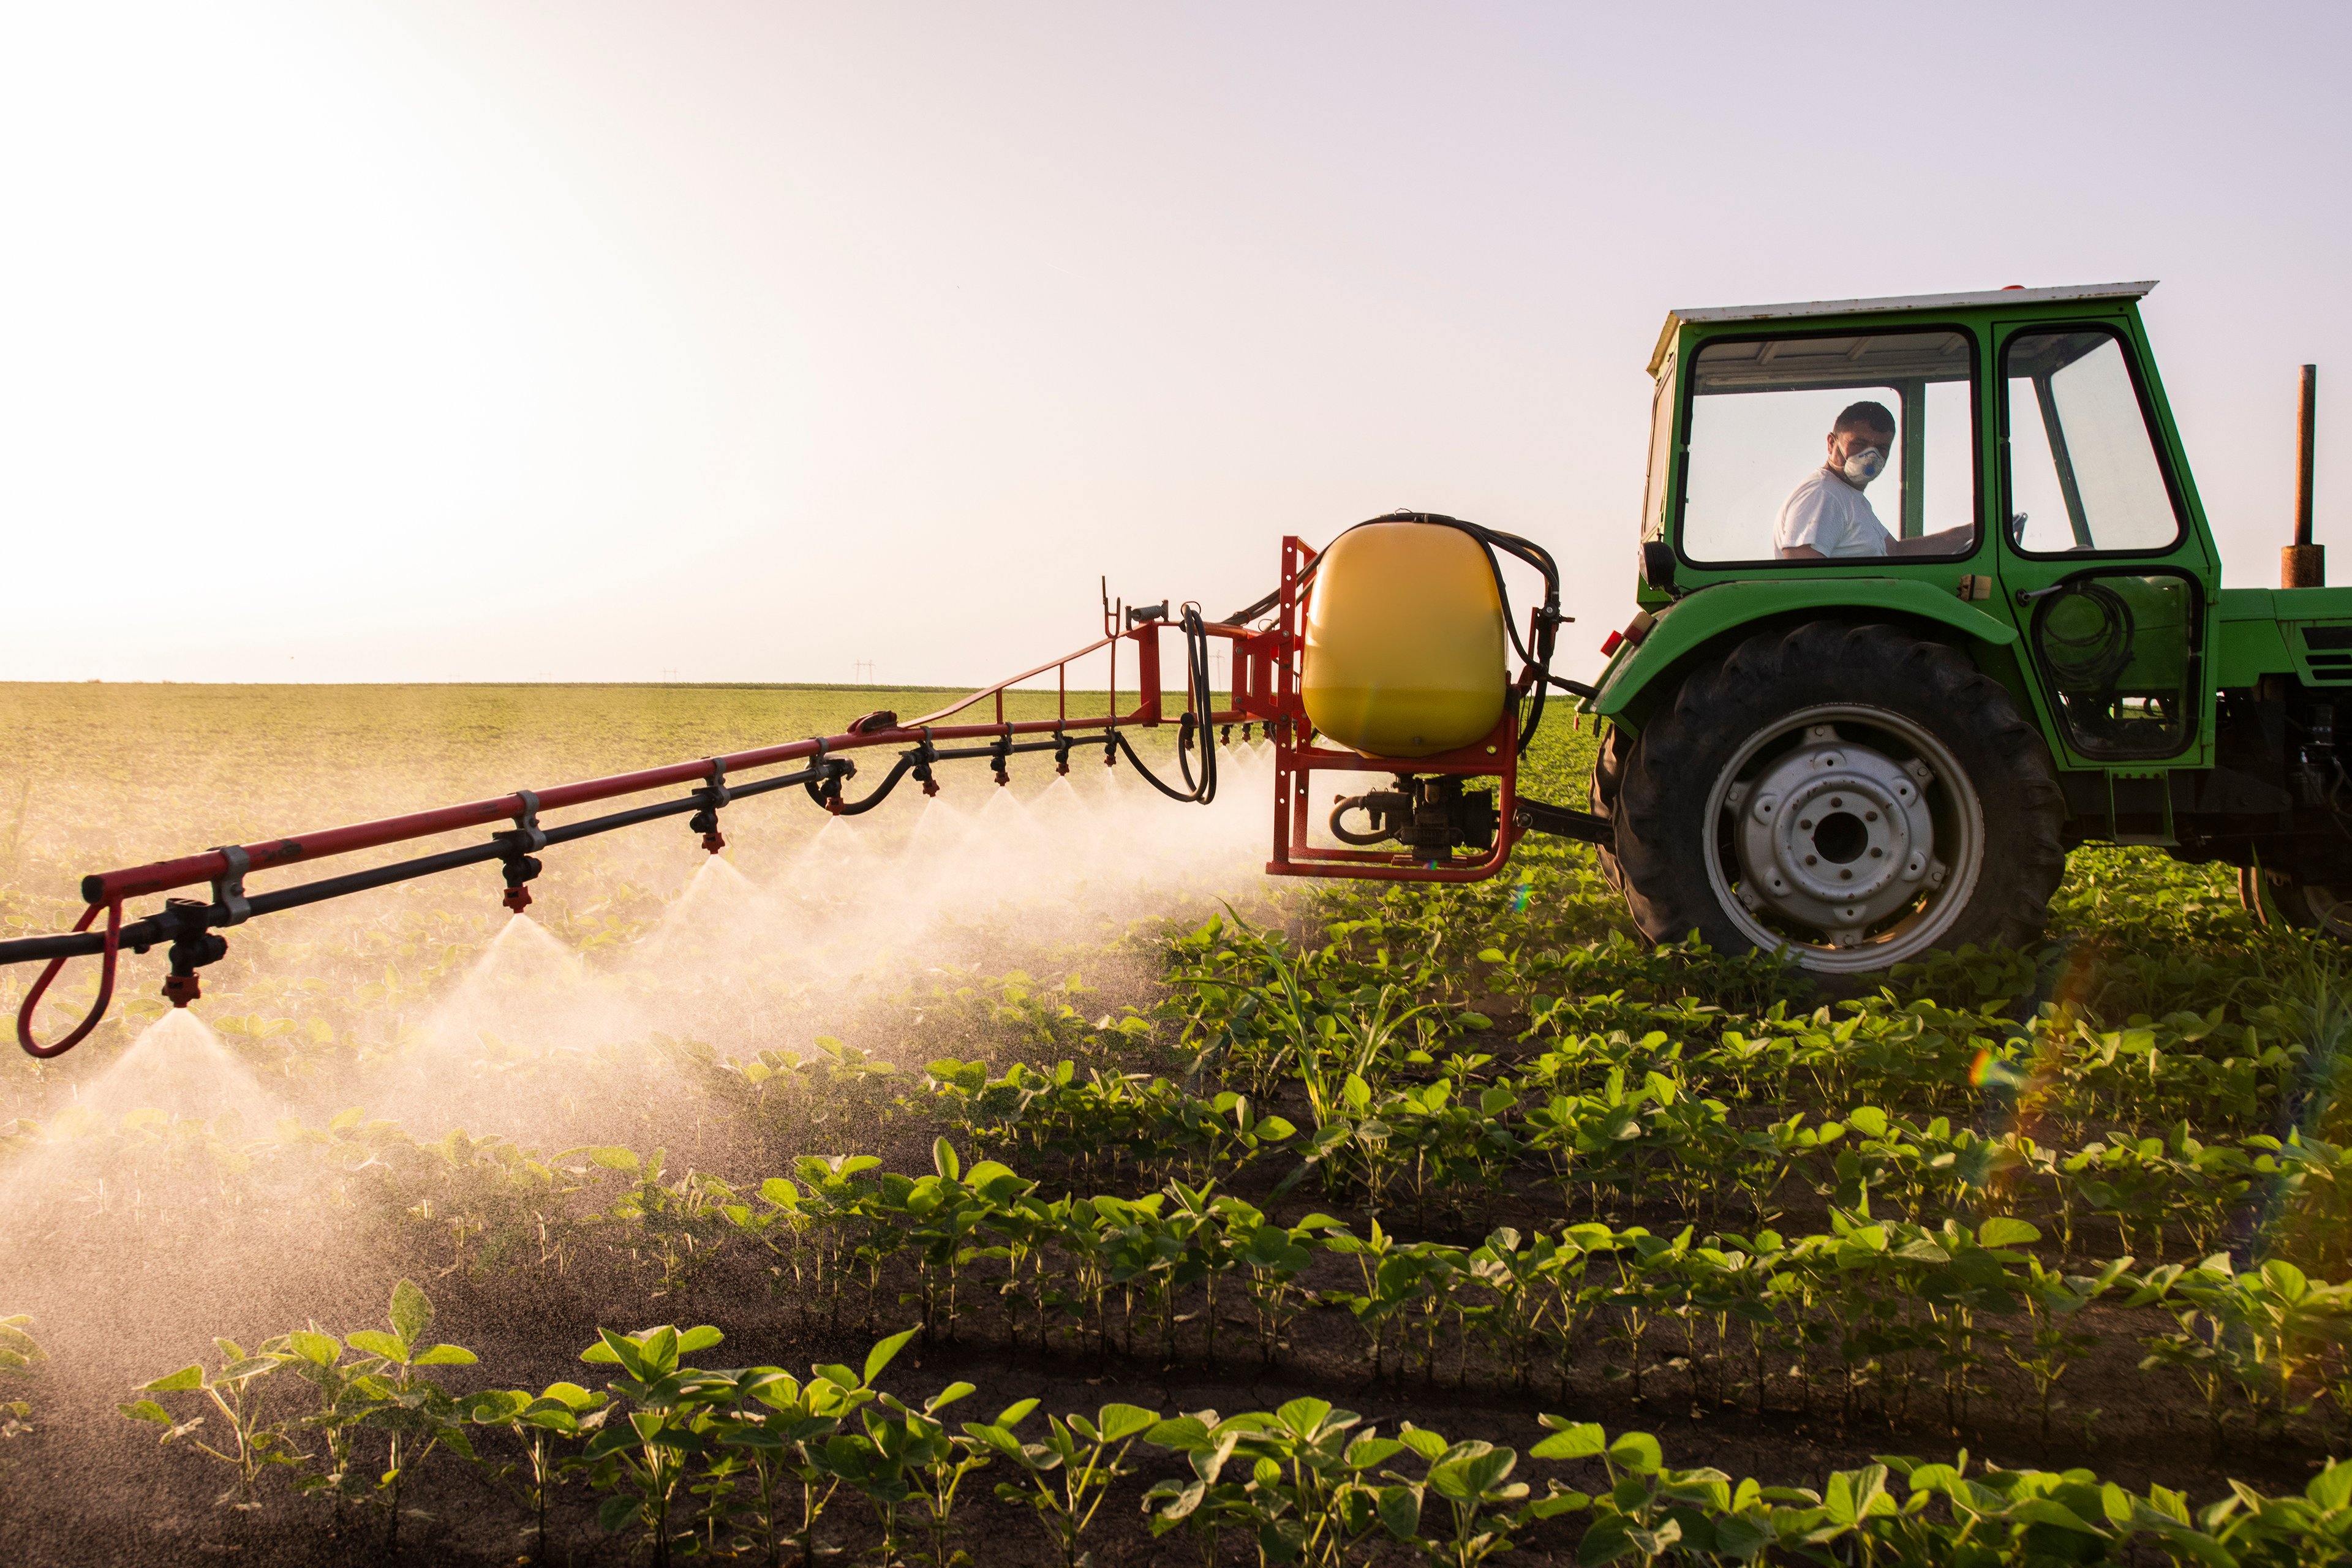
FMC helps farmers protect crops from bugs and weeds. It makes chemicals that keep plants healthy and increase food. The company serves growers in almost every major region.

Tools for the Modern Field

  • Insecticides: Main chemicals used to kill pests like beetles; includes high-tech insect control products like Rynaxypyr and Cyazypyr.
  • Herbicides: Solutions used to stop weed growth in fields of major crops including soybeans, wheat, and cotton.
  • Fungicides: Specialty treatments that protect high-value crops from fungal diseases like rust, blight, and rot.
  • Plant Health: Biological products made from natural sources and nutrients that improve crop quality and resilience.

Shifting Gears and Selling Assets

  • Authorized the exploration of a potential sale of FMC in February 2026 to maximize value for shareholders.
  • Approved a plan to divest the commercial business in India during July 2025 to optimize the global portfolio.
  • Launched Project Foundation in 2025 to reduce structural costs by closing expensive manufacturing and production sites.
  • Generated $165 million in cost benefits through a major restructuring program completed during 2024.

Science Behind the Seeds

FMC maintains an extensive global presence with roughly 5,500 employees working across four major geographical regions. The company holds a significant intellectual property estate with over 2,200 active patents to protect its chemical and biological innovations.

The Financial Scorecard

  • Free cash flow hit $707.1 million in Q4 2025, up 87.1% from the same period in 2024.
  • Revenue reached $1.1 billion in Q4 2025, down 7.2% compared to the prior year.
  • Operating cash flow was $636.8 million in Q4 2025, up 59.4% year-over-year.
  • Net income fell to -$1.7 billion in Q4 2025, down 10142.9% from Q4 2024.

Bottom Line

FMC has shifted its focus toward high-tech, patent-protected agricultural chemicals and biological solutions. The company is currently streamlining its manufacturing footprint while exploring a potential sale to address ongoing market challenges.

AI Generated • Apr 27, 2026

Industry

Chemicals

Sector

Materials

Employees

5,500

CEO

Pierre R. Brondeau, PhD

Headquarters

Philadelphia, PA 19104, US

FMC Financials

Key Financial Metrics (TTM)

Gross Margin

35.29%

Operating Margin

-65.22%

Net Income Margin

-71.05%

Return on Equity

-120.52%

Return on Capital

-30.09%

Return on Assets

-25.26%

Earnings Yield

-2.00%

Dividend Yield

8.19%

Payout Ratio

-7.18%

Stock Overview

Market Cap

$1.25BMarket cap calculated using publicly traded shares outstanding only. Does not include unlisted, private, or dual-class non-traded shares. Implied market cap may vary.

Shares Outstanding

125.23M

Volume

9.91M

Avg. Volume

3.87M

Financials (TTM)

Gross Profit

$1.15B

Operating Income

-$2.12B

EBITDA

-$811.90M

Operating Cash Flow

$190.70M

Capital Expenditure

$46.60M

Free Cash Flow

$237.30M

Cash & ST Invst.

$476.60M

Total Debt

$326.30M

FMC Performance Analysis

FMC annual revenue and year-over-year revenue growth by fiscal year
Fiscal yearPeriod endRevenueYoY growth
20222022-12-31USD 5,802,300,00015.0%
20232023-12-31USD 4,486,800,000-22.7%
20242024-12-31USD 4,246,100,000-5.4%
20252025-12-31USD 3,467,400,000-18.3%
FMC sequential (quarter-over-quarter) revenue growth by fiscal quarter
Fiscal quarterPeriod endQoQ growth
Q32025-09-30-53.5%
Q42025-12-31132.4%
Q12026-03-31-33.3%
Q22026-06-3014.3%
FMC annual diluted earnings per share and year-over-year EPS growth by fiscal year
Fiscal yearPeriod endDiluted EPSYoY growth
20222022-12-31USD 5.801.5%
20232023-12-31USD 10.5181.2%
20242024-12-31USD 2.71-74.2%
20252025-12-31USD -17.90N/A
FMC sequential (quarter-over-quarter) diluted earnings per share growth by fiscal quarter
Fiscal quarterPeriod endQoQ growth
Q32025-09-30-952.8%
Q42025-12-31-204.6%
Q12026-03-3183.7%
Q22026-06-3034.2%

Revenue Growth Rate

Annual and quarterly growth comparison

Earnings Per Share Growth Rate

Annual and quarterly EPS growth comparison

Quarterly Performance

Name
Q2 2026YOY CHG

Revenue

$867.10M

-17.5%

Gross Profit

$342.10M

-16.0%

Gross Margin

39.45%

N/A

Market Cap

$1.25BMarket cap calculated using publicly traded shares outstanding only. Does not include unlisted, private, or dual-class non-traded shares. Implied market cap may vary.

N/A

Market Cap/Employee

$227.91K

N/A

Employees

5,500

N/A

Net Income

$261.30M

+291.8%

EBITDA

-$412.50M

-342.5%

Quarterly Fundamentals

Name
Q2 2026YOY CHG

Total Cash

$476.60M

+8.8%

Total Debt

$326.30M

-92.2%

Accounts Receivable

$2.07B

-32.7%

Inventory

$1.21B

-13.4%

Long Term Debt

$0.00

-100.0%

Short Term Debt

$326.30M

-63.5%

Return on Assets

-25.26%

N/A

Return on Invested Capital

-31.34%

N/A

Free Cash Flow

$395.30M

+1045.8%

Operating Cash Flow

$378.70M

+665.1%

Other Investments to Explore

People Also Watch

Symbol / CompanyPricePrice Chg
USARUSA Rare Earth Inc
$14.65+12.09%
HUNHuntsman Corporation
$12.07+0.92%
IOSPInnospec Inc.
$86.07+1.32%
MTXMinerals Technologies Inc.
$72.51-1.67%

Trending Stocks

Symbol / CompanyPricePrice Chg
INTCIntel
$91.13+0.11%
NVDANvidia
$195.04+0.03%
MSFTMicrosoft
$451.10+0.16%
NOKNokia
$9.09+0.08%

Questions About FMC

What is the current price of FMC?

FMC is trading at $11.83 per share.

What is the 52-week range for FMC?

Over the past 52 weeks, FMC has traded between $9.95 and $42.77.

How much debt does FMC have?

As of the most recent reporting period, FMC reported total debt of $4.28B.

How much cash does FMC have on hand?

FMC reported $476.60M in cash and cash equivalents in its most recent financial results.

What is FMC’s dividend yield?

FMC currently has a dividend yield of 8.19%.

Premium Investing Services

Invest better with The Motley Fool. Get stock recommendations, portfolio guidance, and more from The Motley Fool's premium services.