Accessibility Menu
Leggett & Platt logo

Leggett & Platt(NYSE) LEG

Market Cap$1.32BMarket cap calculated using publicly traded shares outstanding only. Does not include unlisted, private, or dual-class non-traded shares. Implied market cap may vary.
Since IPO (1979)+6,418%
5 Year-75%
1 Year+5%
1 Month-9%
$9.46
-2.32%
-0.22Today
Leggett & Platt last closing stock price
MetricPriceDate
Last closeUSD 9.682026-08-19
Leggett & Platt stock price return by period
PeriodPrice returnPrice at period startPeriod start date
1 week+2.76%USD 9.422026-08-12
1 month-9.14%USD 10.652026-07-20
3 month-2.62%USD 9.942026-05-21
Year to date-10.68%USD 10.842025-12-31
1 year+5.3%USD 9.192025-08-19
3 year-61%USD 24.822023-08-18
5 year-75.15%USD 38.962021-08-20
Since inception+6,418.24%USD 0.151979-06-25

Leggett & Platt Financials at a Glance

Market Cap

$1.32BMarket cap calculated using publicly traded shares outstanding only. Does not include unlisted, private, or dual-class non-traded shares. Implied market cap may vary.

Revenue (TTM)

$3.89B

Net Income (TTM)

$219.40M

EPS (TTM)

$1.56

P/E Ratio

6.20

Dividend

$0.25

Beta (Volatility)

0.99 (Low)

Price

$9.46

Volume

1,079,340.269

Open

$9.47

Previous Close

$9.68

Daily Range

$9.36 - $9.60

52-Week Range

$8.34 - $13.00

Estimated Earnings Date

Oct 26, 2026

LEG: Motley Fool Moneyball Superscore

41

Our CEO Is Handing Members His Secret Weapon

It's called Motley Fool Moneyball, our new proprietary AI tool

We spent over half a million dollars in R&D to build a tool that makes stock research faster, sharper, and smarter. Our analysts use it every day, and now, you can too.

Get Access Now

About Leggett & Platt

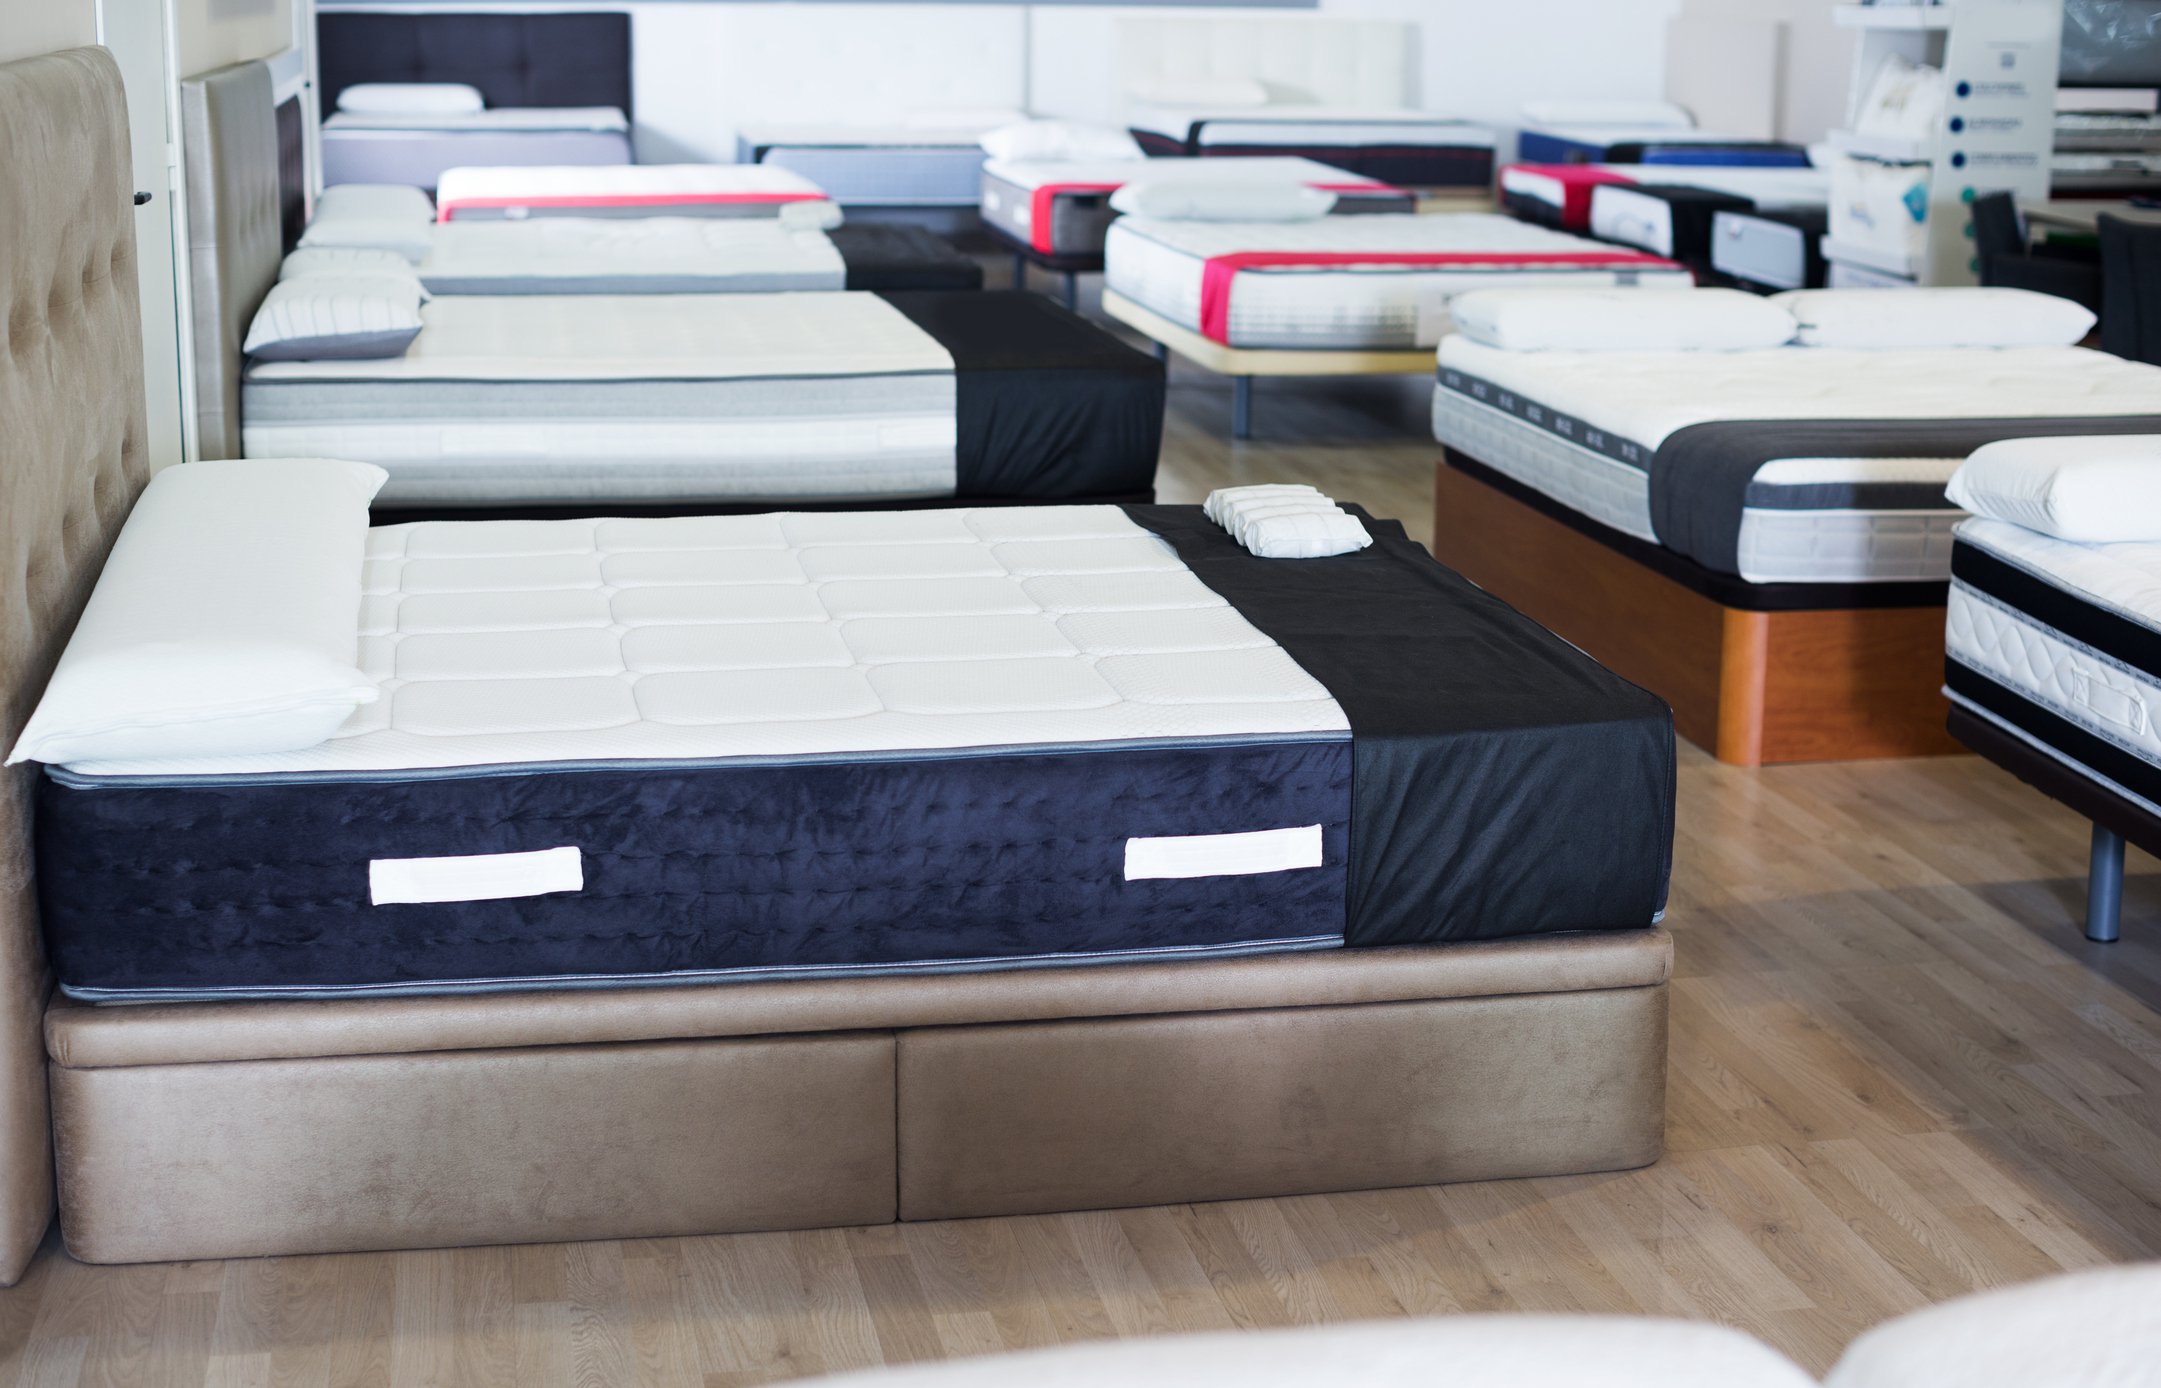
Leggett & Platt, Incorporated makes parts for mattresses and cars. It helps brands build products people use daily. These components stay hidden inside items you buy.

What Is Hidden Inside?

  • Bedding Products: Steel rods, wires, specialty foam, and private-label mattresses; accounted for 39% of trade sales in the first six months of 2026.
  • Specialized Products: Lumbar support systems, seat suspensions, and hydraulic cylinders for vehicles; made up 26% of trade sales in the first six months of 2026.
  • Furniture, Flooring & Textile Products: Mechanisms for reclining chairs, carpet cushions, and structural fabrics; contributed 35% of trade sales in the first six months of 2026.

Recent Moves and Mergers

  • Agreed to a merger with Somnigroup in April 2026 to become a separate business unit.
  • Divested the Aerospace Products Group in August 2025 for $280 million to reduce debt.
  • Started a restructuring plan in February 2026 to consolidate facilities and improve manufacturing efficiency.
  • Began manufacturing in Vietnam in the third quarter of 2025 to mitigate global trade tariffs.

How the Company Stands Out

The company operates approximately 100 production facilities across 18 countries. It uses vertical integration in steel rod and wire to manage costs and maintain quality.

The Financial Scorecard

  • Trade sales were $1.0 billion in the second quarter of 2026, down 6% year over year.
  • Earnings before interest and taxes (EBIT) was $80 million in the second quarter of 2026.
  • Earnings per share were $0.33 in the second quarter of 2026, down from $0.38 in 2025.
  • Operating cash flow reached ($10) million for the first six months of 2026.
  • Price-to-earnings (P/E) ratio was 8.6 in the second quarter of 2026.

The Bottom Line

Leggett & Platt has evolved into a global manufacturer serving multiple consumer industries. Its focus on efficiency and strategic consolidation helps it manage shifting market demand.

AI Generated • Aug 7, 2026

Industry

Household Durables

Employees

15,900

CEO

Karl G. Glassman

Headquarters

Carthage, MO 64836, US

LEG Financials

Key Financial Metrics (TTM)

Gross Margin

18.70%

Operating Margin

6.10%

Net Income Margin

5.63%

Return on Equity

21.32%

Return on Capital

9.22%

Return on Assets

6.09%

Earnings Yield

16.13%

Dividend Yield

2.58%

Payout Ratio

12.35%

Stock Overview

Market Cap

$1.32BMarket cap calculated using publicly traded shares outstanding only. Does not include unlisted, private, or dual-class non-traded shares. Implied market cap may vary.

Shares Outstanding

136.59M

Volume

1.08M

Avg. Volume

2.35M

Financials (TTM)

Gross Profit

$728.00M

Operating Income

$237.60M

EBITDA

$449.80M

Operating Cash Flow

$237.10M

Capital Expenditure

-$80.20M

Free Cash Flow

$156.90M

Cash & ST Invst.

$545.80M

Total Debt

$1.65B

Leggett & Platt Performance Analysis

Leggett & Platt annual revenue and year-over-year revenue growth by fiscal year
Fiscal yearPeriod endRevenueYoY growth
20222022-12-31USD 5,147,200,0001.7%
20232023-12-31USD 4,729,000,000-8.1%
20242024-12-31USD 4,385,200,000-7.3%
20252025-12-31USD 4,058,100,000-7.5%
Leggett & Platt sequential (quarter-over-quarter) revenue growth by fiscal quarter
Fiscal quarterPeriod endQoQ growth
Q32025-09-30-2.0%
Q42025-12-31-9.5%
Q12026-03-31-2.2%
Q22026-06-308.9%
Leggett & Platt annual diluted earnings per share and year-over-year EPS growth by fiscal year
Fiscal yearPeriod endDiluted EPSYoY growth
20222022-12-31USD 2.27-22.9%
20232023-12-31USD -1.00N/A
20242024-12-31USD -3.73271.2%
20252025-12-31USD 1.70N/A
Leggett & Platt sequential (quarter-over-quarter) diluted earnings per share growth by fiscal quarter
Fiscal quarterPeriod endQoQ growth
Q32025-09-30139.5%
Q42025-12-31-80.2%
Q12026-03-31-22.2%
Q22026-06-30135.7%

Revenue Growth Rate

Annual and quarterly growth comparison

Earnings Per Share Growth Rate

Annual and quarterly EPS growth comparison

Quarterly Performance

Name
Q2 2026YOY CHG

Revenue

$999.70M

-5.6%

Gross Profit

$203.20M

+7.4%

Gross Margin

20.33%

N/A

Market Cap

$1.32BMarket cap calculated using publicly traded shares outstanding only. Does not include unlisted, private, or dual-class non-traded shares. Implied market cap may vary.

N/A

Market Cap/Employee

$83.16K

N/A

Employees

15,900

N/A

Net Income

$47.10M

-10.3%

EBITDA

$108.60M

-11.0%

Quarterly Fundamentals

Name
Q2 2026YOY CHG

Total Cash

$545.80M

+48.0%

Total Debt

$1.65B

-15.8%

Accounts Receivable

$568.40M

-1.5%

Inventory

$638.30M

-1.6%

Long Term Debt

$1.60B

-16.1%

Short Term Debt

$50.00M

-4.2%

Return on Assets

6.09%

N/A

Return on Invested Capital

8.42%

N/A

Free Cash Flow

$25.30M

-66.5%

Operating Cash Flow

$45.80M

-45.5%

Other Investments to Explore

People Also Watch

Symbol / CompanyPricePrice Chg
CRICarter's Inc.
$35.66-4.18%
LZBLa-Z-Boy Incorporated
$33.83-0.24%
GIIIG-III Apparel Group, Ltd.
$33.14-2.81%
THRMGentherm Incorporated
$40.27-3.23%

Trending Stocks

Symbol / CompanyPricePrice Chg
BITOProShares Trust - ProShares Bitcoin ETF
$9.83+0.06%
IBITiShares Bitcoin Trust
$41.19+0.06%
SPCXSpace Exploration Technologies
$130.74-0.06%
TSLLDirexion Shares ETF Trust - Direxion Daily Tsla Bull 2x ETF
$8.82-0.04%

Questions About LEG

What is the current price of Leggett & Platt?

Leggett & Platt is trading at $9.46 per share.

What is the 52-week range for Leggett & Platt?

Over the past 52 weeks, Leggett & Platt has traded between $8.34 and $13.00.

How much debt does Leggett & Platt have?

As of the most recent reporting period, Leggett & Platt reported total debt of $1.65B.

How much cash does Leggett & Platt have on hand?

Leggett & Platt reported $545.80M in cash and cash equivalents in its most recent financial results.

What is Leggett & Platt’s dividend yield?

Leggett & Platt currently has a dividend yield of 2.58%.

Premium Investing Services

Invest better with The Motley Fool. Get stock recommendations, portfolio guidance, and more from The Motley Fool's premium services.