Accessibility Menu
Mach Natural Resources logo

Mach Natural Resources(NYSE) MNR

Market Cap$2.11BMarket cap calculated using publicly traded shares outstanding only. Does not include unlisted, private, or dual-class non-traded shares. Implied market cap may vary.
Since IPO (2023)+5%
5 YearN/A
1 Year+5%
1 Month-3%
Premium Feature
Moneyball Superscore
52/100
$12.53
-0.87%
-0.11Today
After hours$12.52-$0.01 (-0.08%)
Mach Natural Resources last closing stock price
MetricPriceDate
Last closeUSD 12.642026-08-24
Mach Natural Resources stock price return by period
PeriodPrice returnPrice at period startPeriod start date
1 week-0.39%USD 12.692026-08-17
1 month-2.91%USD 13.022026-07-24
3 month-5.11%USD 13.322026-05-26
Year to date+28.13%USD 9.872025-12-31
1 year+5.05%USD 12.032025-08-22
Since inception+4.92%USD 12.052023-10-25

Mach Natural Resources Financials at a Glance

Market Cap

$2.11BMarket cap calculated using publicly traded shares outstanding only. Does not include unlisted, private, or dual-class non-traded shares. Implied market cap may vary.

Revenue (TTM)

$1.45B

Net Income (TTM)

$243.60M

EPS (TTM)

$0.53

P/E Ratio

23.90

Dividend

$1.80

Beta (Volatility)

0.00 (Low)

Price

$12.53

Volume

285,066.359

Open

$12.64

Previous Close

$12.52

Daily Range

$12.52 - $12.69

52-Week Range

$10.46 - $15.02

Estimated Earnings Date

Nov 5, 2026

MNR: Motley Fool Moneyball Superscore

52

Our CEO Is Handing Members His Secret Weapon

It's called Motley Fool Moneyball, our new proprietary AI tool

We spent over half a million dollars in R&D to build a tool that makes stock research faster, sharper, and smarter. Our analysts use it every day, and now, you can too.

Get Access Now

About Mach Natural Resources

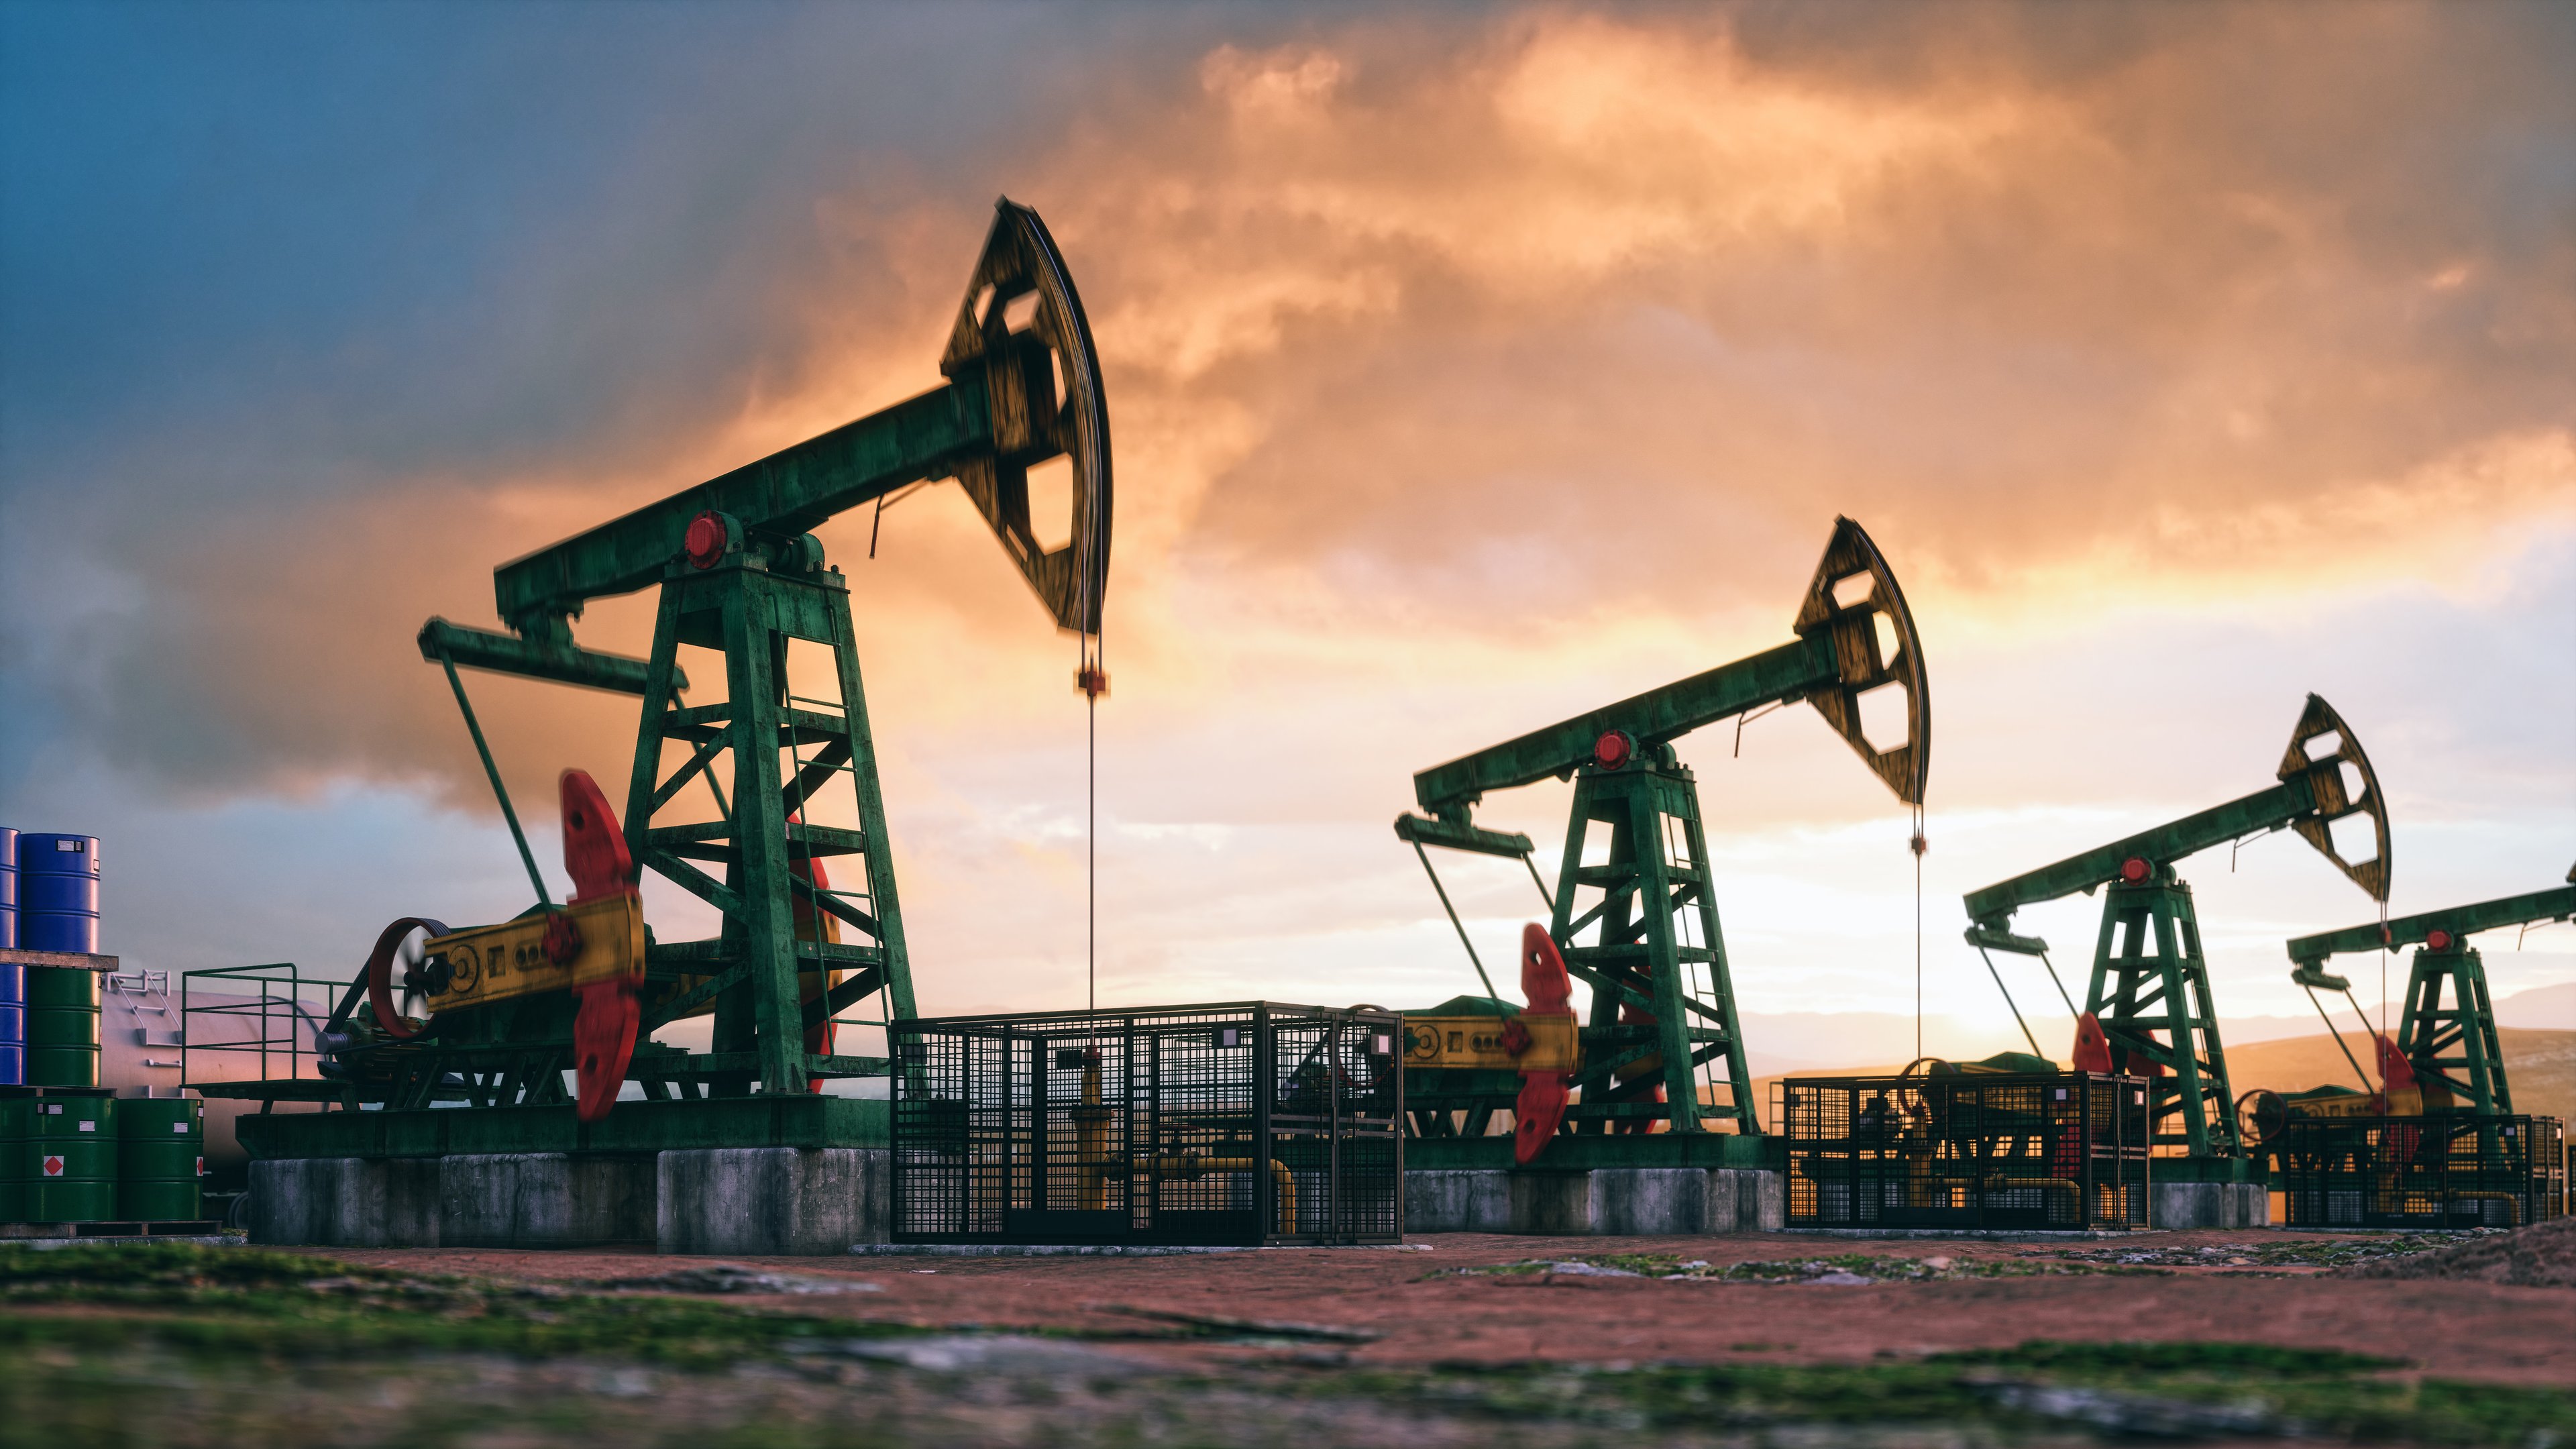
Mach Natural Resources LP pumps oil and gas from the ground. These fuels help power cars and heat homes. The company also owns equipment to move these fuels.

What Mach Pumps and Processes

  • Crude Oil: Liquid energy source extracted from underground formations for sale to global markets.
  • Natural Gas: Gaseous fuel used primarily for generating electricity and heating buildings.
  • Natural Gas Liquids: Products such as propane and butane separated from natural gas during processing.
  • Midstream Services: Systems of pipelines and plants that gather and treat fuel before it reaches buyers.

Growing Through Strategic Deals

  • Completed four acquisitions since the start of 2025 to increase production capacity.
  • Closed the IKAV and Sabinal Acquisitions in Sept. 2025 to expand assets into the Anadarko and Permian Basins.
  • Entered a new credit agreement in Feb. 2025 to provide funding for future projects.
  • Increased the borrowing base under the credit agreement to $1.18 billion in Sept. 2025 to support growth.

The Midstream Advantage

Mach owns gathering systems and processing plants that handle its own production and serve other companies. This integrated approach helps lower costs and ensures that fuels move efficiently to the market.

By the Numbers

  • Total revenues hit $405,955,000 in the three-month period ended June 30, 2026, up 41% year over year.
  • Net production volumes reached 13,549 MBoe (thousands of barrels of oil equivalent) for the three-month period ended June 30, 2026, up 78% year over year.
  • The company spent $171.8 million on development costs during the six-month period ended June 30, 2026.
  • Market capitalization was $2.1 billion as of Q2 2026, representing a 23.9% increase year over year.

Moving the Business Forward

Mach has transformed into a larger producer through aggressive acquisitions while focusing on assets with low decline rates. Its ownership of midstream infrastructure provides operational stability and supports the distribution of available cash to unitholders.

AI Generated • Aug 7, 2026

Industry

Oil, Gas and Consumable Fuels

Sector

Energy

Employees

840

CEO

Tom L. Ward

Headquarters

Oklahoma City, OK 73134, US

MNR Financials

Key Financial Metrics (TTM)

Gross Margin

53.24%

Operating Margin

20.13%

Net Income Margin

16.81%

Return on Equity

12.74%

Return on Capital

10.64%

Return on Assets

6.63%

Earnings Yield

4.18%

Dividend Yield

14.24%

Payout Ratio

1.18%

Stock Overview

Market Cap

$2.11BMarket cap calculated using publicly traded shares outstanding only. Does not include unlisted, private, or dual-class non-traded shares. Implied market cap may vary.

Shares Outstanding

166.95M

Volume

285.07K

Avg. Volume

328.94K

Financials (TTM)

Gross Profit

$771.45M

Operating Income

$291.64M

EBITDA

$587.03M

Operating Cash Flow

$558.26M

Capital Expenditure

-$398.68M

Free Cash Flow

$159.58M

Cash & ST Invst.

$41.19M

Total Debt

$1.19B

Mach Natural Resources Performance Analysis

Mach Natural Resources annual revenue and year-over-year revenue growth by fiscal year
Fiscal yearPeriod endRevenueYoY growth
20222022-12-31USD 1,004,867,000N/A
20232023-12-31USD 705,037,000-29.8%
20242024-12-31USD 988,482,00040.2%
20252025-12-31USD 1,094,101,00010.7%
Mach Natural Resources sequential (quarter-over-quarter) revenue growth by fiscal quarter
Fiscal quarterPeriod endQoQ growth
Q32025-09-30-5.5%
Q42025-12-3142.2%
Q12026-03-31-1.2%
Q22026-06-306.0%
Mach Natural Resources annual diluted earnings per share and year-over-year EPS growth by fiscal year
Fiscal yearPeriod endDiluted EPSYoY growth
20222022-12-31USD 5.44N/A
20232023-12-31USD 0.72-86.7%
20242024-12-31USD 1.90162.8%
20252025-12-31USD 1.09-42.7%
Mach Natural Resources sequential (quarter-over-quarter) diluted earnings per share growth by fiscal quarter
Fiscal quarterPeriod endQoQ growth
Q32025-09-30-136.8%
Q42025-12-31267.9%
Q12026-03-31-144.7%
Q22026-06-30376.2%

Revenue Growth Rate

Annual and quarterly growth comparison

Earnings Per Share Growth Rate

Annual and quarterly EPS growth comparison

Quarterly Performance

Name
Q2 2026YOY CHG

Revenue

$405.96M

+40.7%

Gross Profit

$400.55M

+233.5%

Gross Margin

98.67%

N/A

Market Cap

$2.11BMarket cap calculated using publicly traded shares outstanding only. Does not include unlisted, private, or dual-class non-traded shares. Implied market cap may vary.

N/A

Market Cap/Employee

$2.51M

N/A

Employees

840

N/A

Net Income

$98.21M

+9.5%

EBITDA

$220.96M

+30.8%

Quarterly Fundamentals

Name
Q2 2026YOY CHG

Total Cash

$41.19M

+199.0%

Total Debt

$1.19B

+105.2%

Accounts Receivable

$215.30M

+46.6%

Inventory

$42.37M

+64.0%

Long Term Debt

$1.18B

+105.5%

Short Term Debt

$8.86M

+68.1%

Return on Assets

6.63%

N/A

Return on Invested Capital

8.80%

N/A

Free Cash Flow

$58.29M

+1408.3%

Operating Cash Flow

$153.65M

+18.1%

Other Investments to Explore

People Also Watch

Symbol / CompanyPricePrice Chg
PBTPermian Basin Royalty Trust
$34.61-0.40%
SBRSabine Royalty Trust
$74.46+2.35%
SJTSan Juan Basin Royalty Trust
$2.93+5.40%
NRTNorth European Oil Royalty Trust
$8.56-0.58%

Trending Stocks

Symbol / CompanyPricePrice Chg
SMRNuScale Power
$9.81+0.08%
SNAPSnap
$5.92+0.07%
NOKNokia
$10.35+0.04%
FFord Motor Company
$13.95+0.00%

Questions About MNR

What is the current price of Mach Natural Resources?

Mach Natural Resources is trading at $12.52 per share.

What is the 52-week range for Mach Natural Resources?

Over the past 52 weeks, Mach Natural Resources has traded between $10.46 and $15.02.

How much debt does Mach Natural Resources have?

As of the most recent reporting period, Mach Natural Resources reported total debt of $1.19B.

How much cash does Mach Natural Resources have on hand?

Mach Natural Resources reported $41.19M in cash and cash equivalents in its most recent financial results.

What is Mach Natural Resources’s dividend yield?

Mach Natural Resources currently has a dividend yield of 14.24%.

Premium Investing Services

Invest better with The Motley Fool. Get stock recommendations, portfolio guidance, and more from The Motley Fool's premium services.