Accessibility Menu
CSX logo

CSX(NASDAQ) CSX

Current Price$52.72
Market Cap$92.78BMarket cap calculated using publicly traded shares outstanding only. Does not include unlisted, private, or dual-class non-traded shares. Implied market cap may vary.
Since IPO (1980)+13,130%
5 Year+63%
1 Year+44%
1 Month+8%
CSX last closing stock price
MetricPriceDate
Last closeUSD 49.932026-07-22
CSX stock price return by period
PeriodPrice returnPrice at period startPeriod start date
1 week+1.01%USD 49.432026-07-15
1 month+8.07%USD 46.202026-06-22
3 month+8.45%USD 46.042026-04-23
Year to date+38.62%USD 36.022025-12-31
1 year+43.73%USD 34.742025-07-22
3 year+60.56%USD 31.102023-07-21
5 year+62.86%USD 30.662021-07-23
Since inception+13,129.52%USD 0.381980-11-03

CSX Financials at a Glance

Market Cap

$92.78BMarket cap calculated using publicly traded shares outstanding only. Does not include unlisted, private, or dual-class non-traded shares. Implied market cap may vary.

Revenue (TTM)

$14.51B

Net Income (TTM)

$3.22B

EPS (TTM)

$1.63

P/E Ratio

30.54

Dividend

$0.54

Beta (Volatility)

0.77 (Low)

Price

$52.72

Volume

17,401,621.098

Open

$51.96

Previous Close

$49.93

Daily Range

$51.62 - $53.31

52-Week Range

$31.80 - $53.31

Estimated Earnings Date

Oct 15, 2026

CSX: Motley Fool Moneyball Superscore

60

Our CEO Is Handing Members His Secret Weapon

It's called Motley Fool Moneyball, our new proprietary AI tool

We spent over half a million dollars in R&D to build a tool that makes stock research faster, sharper, and smarter. Our analysts use it every day, and now, you can too.

Get Access Now

About CSX

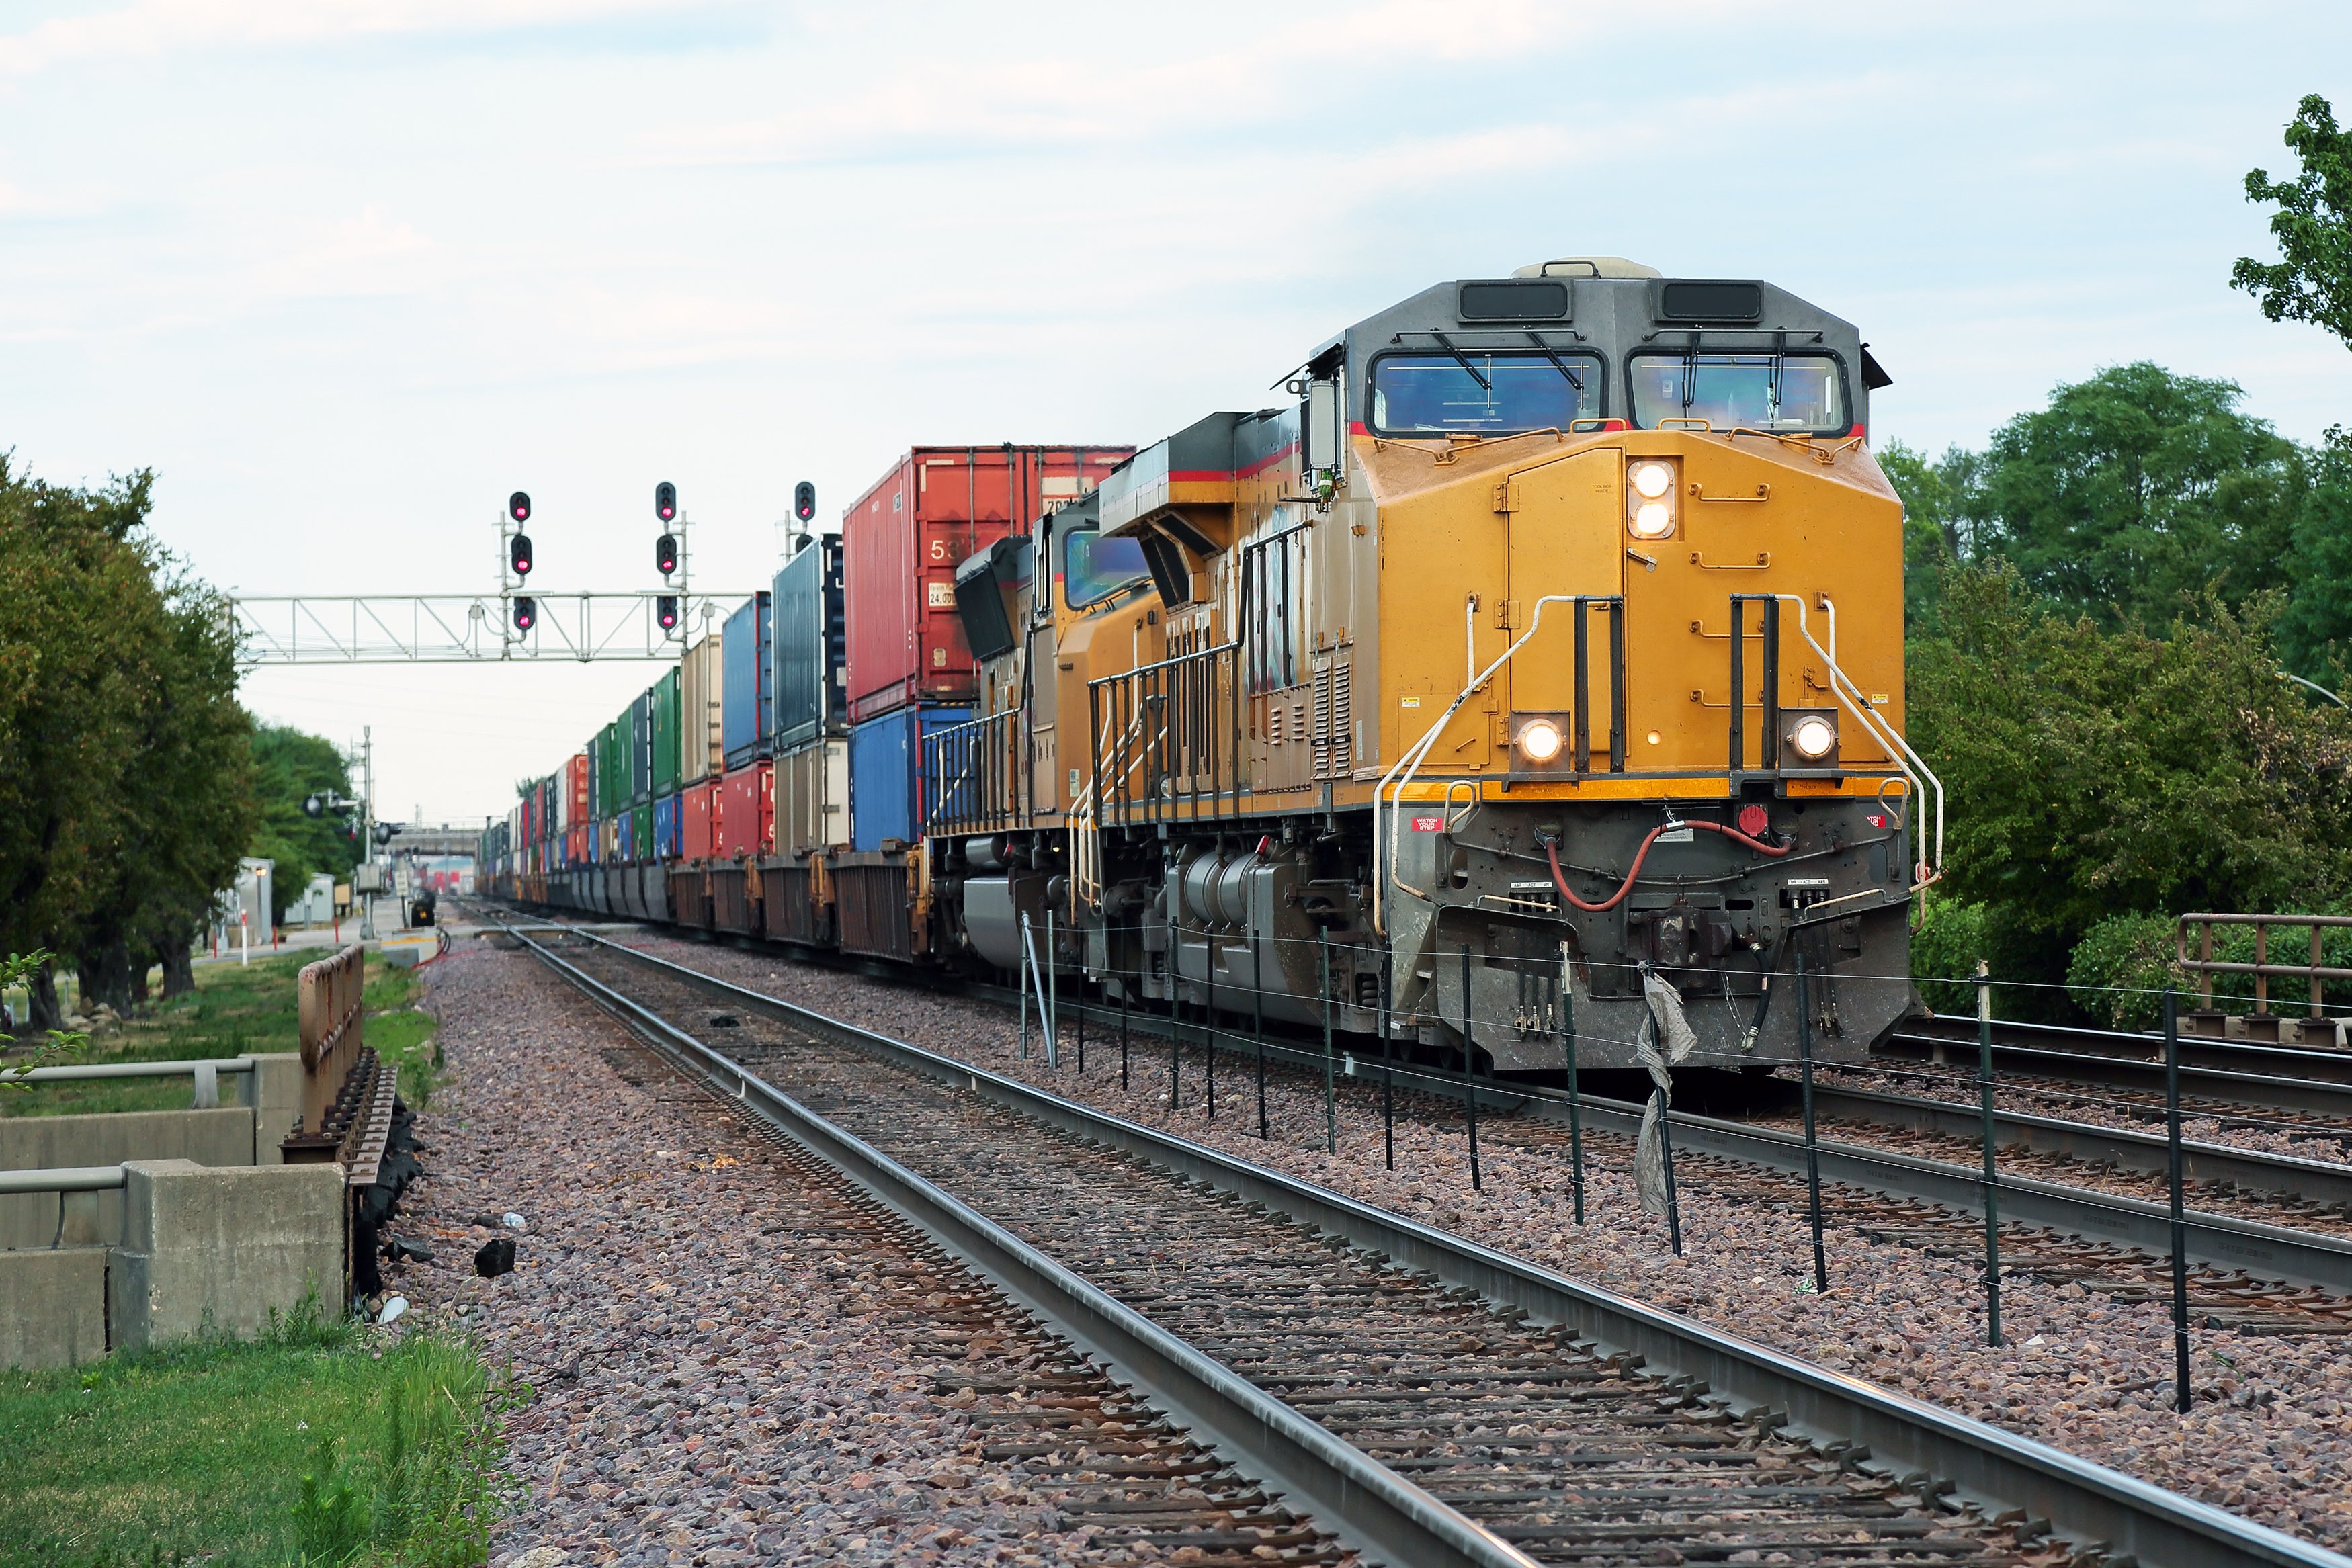
CSX moves freight across the eastern United States using a large network of trains and trucks. It helps businesses ship heavy goods like coal, chemicals, and cars more efficiently than driving them by road. This service keeps store shelves full and provides fuel for power plants and factories.

Freight by the Trainload

  • Merchandise: Transports chemicals, farm products, cars, minerals, and metals for industrial customers; generated 62% of revenue in 2025.
  • Intermodal: Moves shipping containers using both rail and trucks to provide flexible delivery for consumer goods; accounted for 15% of revenue in 2025.
  • Coal: Delivers domestic and export coal to power plants, steel manufacturers, and port facilities; made up 13% of revenue in 2025.
  • Trucking: Provides specialized liquid chemical transport through Quality Carriers and other logistics services; contributed 6% of revenue in 2025.

Recent Moves and Strategic Shifts

  • Acquired Quality Carriers to become the largest North American provider of bulk liquid chemical truck transportation.
  • Integrated the Pan Am rail network to extend service directly into New England and the New York metropolitan area.
  • Ratified new labor agreements for 75% of the unionized workforce as of early 2026 to ensure stable operations.
  • Invested in the Howard Street tunnel project to improve network fluidity and reduce congestion in key shipping corridors.

What Makes CSX Different?

The company operates a 20,000 route-mile network serving 26 states and two Canadian provinces with exclusive access to over 70 port terminals. This infrastructure connects every major population center in the eastern U.S. to global shipping lanes and western rail gateways.

The 2025 Financial Scorecard

  • Revenue reached $14.1 billion in 2025, a 3% decrease from the previous year.
  • Operating income was $4.5 billion in 2025, down 14% year-over-year.
  • Free cash flow rose to $709 million in Q4 2025, up 28.9% from Q4 2024.
  • Net income for Q4 2025 was $720 million, down 1.8% from the same period in 2024.
  • Share repurchases totaled $112 million during the fourth quarter of 2025.

The Long View

CSX has transformed from a traditional 19th-century railroad into a modern logistics provider by adding trucking and digital technology to its rail core. Its ability to move diverse goods across a fixed, essential network remains central to North American trade.

AI Generated • Apr 18, 2026

Industry

Road and Rail

Employees

22,200

CEO

Stephen F. Angel, MBA

Headquarters

Jacksonville, FL 32202, US

CSX Financials

Key Financial Metrics (TTM)

Gross Margin

37.54%

Operating Margin

33.45%

Net Income Margin

21.55%

Return on Equity

23.52%

Return on Capital

13.91%

Return on Assets

6.90%

Earnings Yield

3.27%

Dividend Yield

1.08%

Payout Ratio

32.36%

Stock Overview

Market Cap

$92.78BMarket cap calculated using publicly traded shares outstanding only. Does not include unlisted, private, or dual-class non-traded shares. Implied market cap may vary.

Shares Outstanding

1.86B

Volume

17.40M

Avg. Volume

12.67M

Financials (TTM)

Gross Profit

$4.03B

Operating Income

$4.96B

EBITDA

$5.64B

Operating Cash Flow

$5.32B

Capital Expenditure

$818.00M

Free Cash Flow

$6.14B

Cash & ST Invst.

$1.01B

Total Debt

$2.20B

CSX Performance Analysis

CSX annual revenue and year-over-year revenue growth by fiscal year
Fiscal yearPeriod endRevenueYoY growth
20222022-12-31USD 14,853,000,00018.6%
20232023-12-31USD 14,657,000,000-1.3%
20242024-12-31USD 14,540,000,000-0.8%
20252025-12-31USD 14,092,000,000-3.1%
CSX sequential (quarter-over-quarter) revenue growth by fiscal quarter
Fiscal quarterPeriod endQoQ growth
Q22025-06-304.4%
Q32025-09-300.4%
Q42025-12-31-2.2%
Q12026-03-31-0.7%
CSX annual diluted earnings per share and year-over-year EPS growth by fiscal year
Fiscal yearPeriod endDiluted EPSYoY growth
20222022-12-31USD 1.9516.0%
20232023-12-31USD 1.82-6.4%
20242024-12-31USD 1.79-2.0%
20252025-12-31USD 1.54-13.6%
CSX sequential (quarter-over-quarter) diluted earnings per share growth by fiscal quarter
Fiscal quarterPeriod endQoQ growth
Q22025-06-3029.4%
Q32025-09-30-15.9%
Q42025-12-315.4%
Q12026-03-3110.3%

Revenue Growth Rate

Annual and quarterly growth comparison

Earnings Per Share Growth Rate

Annual and quarterly EPS growth comparison

Quarterly Performance

Name
Q2 2026YOY CHG

Revenue

$3.94B

+10.1%

Gross Profit

$0.00

-100.0%

Gross Margin

0.00%

N/A

Market Cap

$92.78BMarket cap calculated using publicly traded shares outstanding only. Does not include unlisted, private, or dual-class non-traded shares. Implied market cap may vary.

N/A

Market Cap/Employee

$4.03M

N/A

Employees

23,000

N/A

Net Income

$1.00B

+20.9%

EBITDA

$884.00M

-49.0%

Quarterly Fundamentals

Name
Q2 2026YOY CHG

Total Cash

$1.01B

+156.2%

Total Debt

$2.20B

-88.8%

Accounts Receivable

$1.46B

+3.3%

Inventory

$0.00

-100.0%

Long Term Debt

$493.00M

-97.4%

Short Term Debt

$1.70B

+176.3%

Return on Assets

6.90%

N/A

Return on Invested Capital

11.54%

N/A

Free Cash Flow

$1.87B

+1426.2%

Operating Cash Flow

$1.33B

+109.0%

Other Investments to Explore

People Also Watch

Symbol / CompanyPricePrice Chg
CMICummins Inc.
$663.76+0.46%
PWRQuanta Services, Inc.
$648.48+0.83%
CPCanadian Pacific Kansas City Ltd.
$91.83+0.55%
ITWIllinois Tool Works Inc.
$275.59+0.61%

Trending Stocks

Symbol / CompanyPricePrice Chg
TSLLDirexion Shares ETF Trust - Direxion Daily Tsla Bull 2x Shares
$7.84-0.29%
AALAmerican Airlines Group
$13.64-0.08%
TQQQProShares Trust - ProShares UltraPro Qqq
$65.75-0.06%
SOFISoFi Technologies
$16.63-0.03%

Questions About CSX

What is the current price of CSX?

CSX is trading at $52.71 per share.

What is the 52-week range for CSX?

Over the past 52 weeks, CSX has traded between $31.80 and $53.31.

How much debt does CSX have?

As of the most recent reporting period, CSX reported total debt of $19.36B.

How much cash does CSX have on hand?

CSX reported $1.01B in cash and cash equivalents in its most recent financial results.

What is CSX’s dividend yield?

CSX currently has a dividend yield of 1.08%.

Premium Investing Services

Invest better with The Motley Fool. Get stock recommendations, portfolio guidance, and more from The Motley Fool's premium services.