Accessibility Menu
Hycroft Mining logo

Hycroft Mining(NASDAQ) HYMC

Market Cap$1.82BMarket cap calculated using publicly traded shares outstanding only. Does not include unlisted, private, or dual-class non-traded shares. Implied market cap may vary.
Since IPO (2018)-80%
5 Year-15%
1 Year+499%
1 Month-15%
$19.55
-2.62%
-0.53Today
After hours$19.53-$0.02 (-0.08%)
Hycroft Mining last closing stock price
MetricPriceDate
Last closeUSD 19.532026-07-31
Hycroft Mining stock price return by period
PeriodPrice returnPrice at period startPeriod start date
1 week-3.41%USD 20.222026-07-24
1 month-15.34%USD 23.072026-07-01
3 month-49.57%USD 38.732026-05-01
Year to date-17.84%USD 23.772025-12-31
1 year+499.08%USD 3.262025-07-31
3 year+336.91%USD 4.472023-08-01
5 year-15.09%USD 23.002021-07-30
Since inception-79.64%USD 95.902018-03-12

Hycroft Mining Financials at a Glance

Market Cap

$1.82BMarket cap calculated using publicly traded shares outstanding only. Does not include unlisted, private, or dual-class non-traded shares. Implied market cap may vary.

Revenue (TTM)

$0.00

Net Income (TTM)

-$86.21M

EPS (TTM)

-$1.08

P/E Ratio

-18.09

Dividend

$0.00

Beta (Volatility)

1.12 (Average)

Price

$19.55

Volume

1,063,459.738

Open

$19.51

Previous Close

$19.53

Daily Range

$18.78 - $19.70

52-Week Range

$3.34 - $58.73

Estimated Earnings Date

Oct 27, 2026

HYMC: Motley Fool Moneyball Superscore

32

Our CEO Is Handing Members His Secret Weapon

It's called Motley Fool Moneyball, our new proprietary AI tool

We spent over half a million dollars in R&D to build a tool that makes stock research faster, sharper, and smarter. Our analysts use it every day, and now, you can too.

Get Access Now

About Hycroft Mining

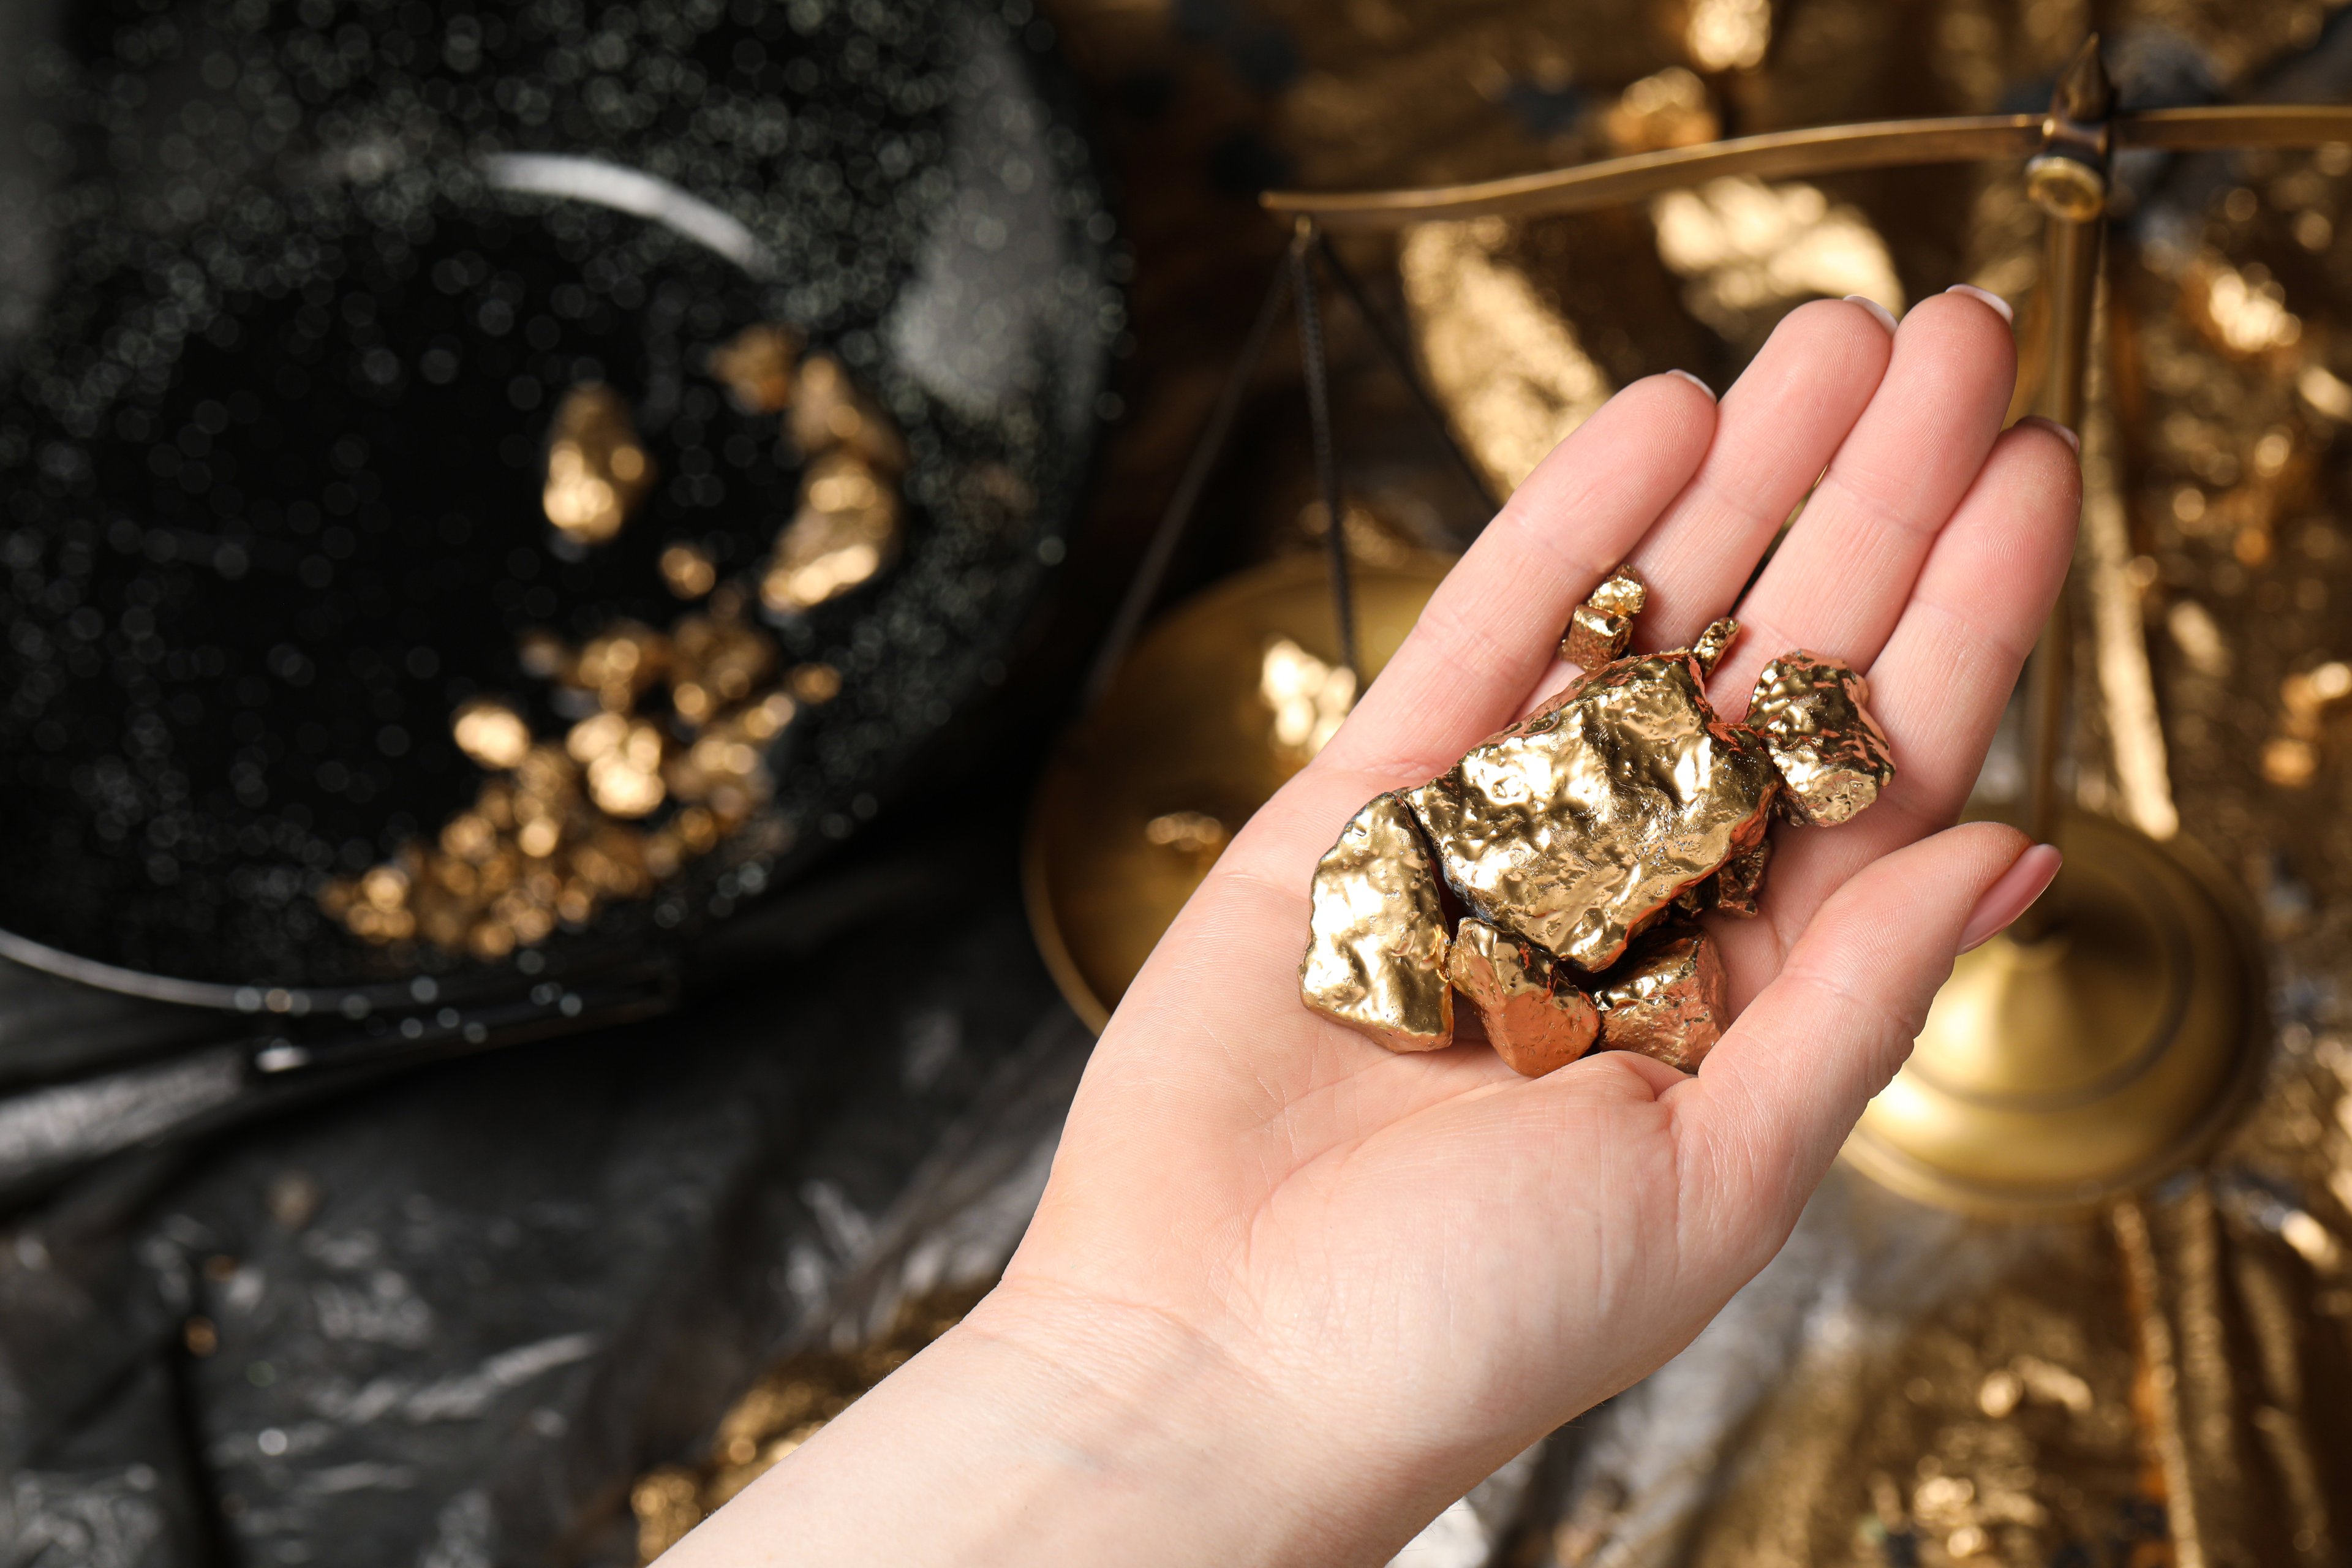
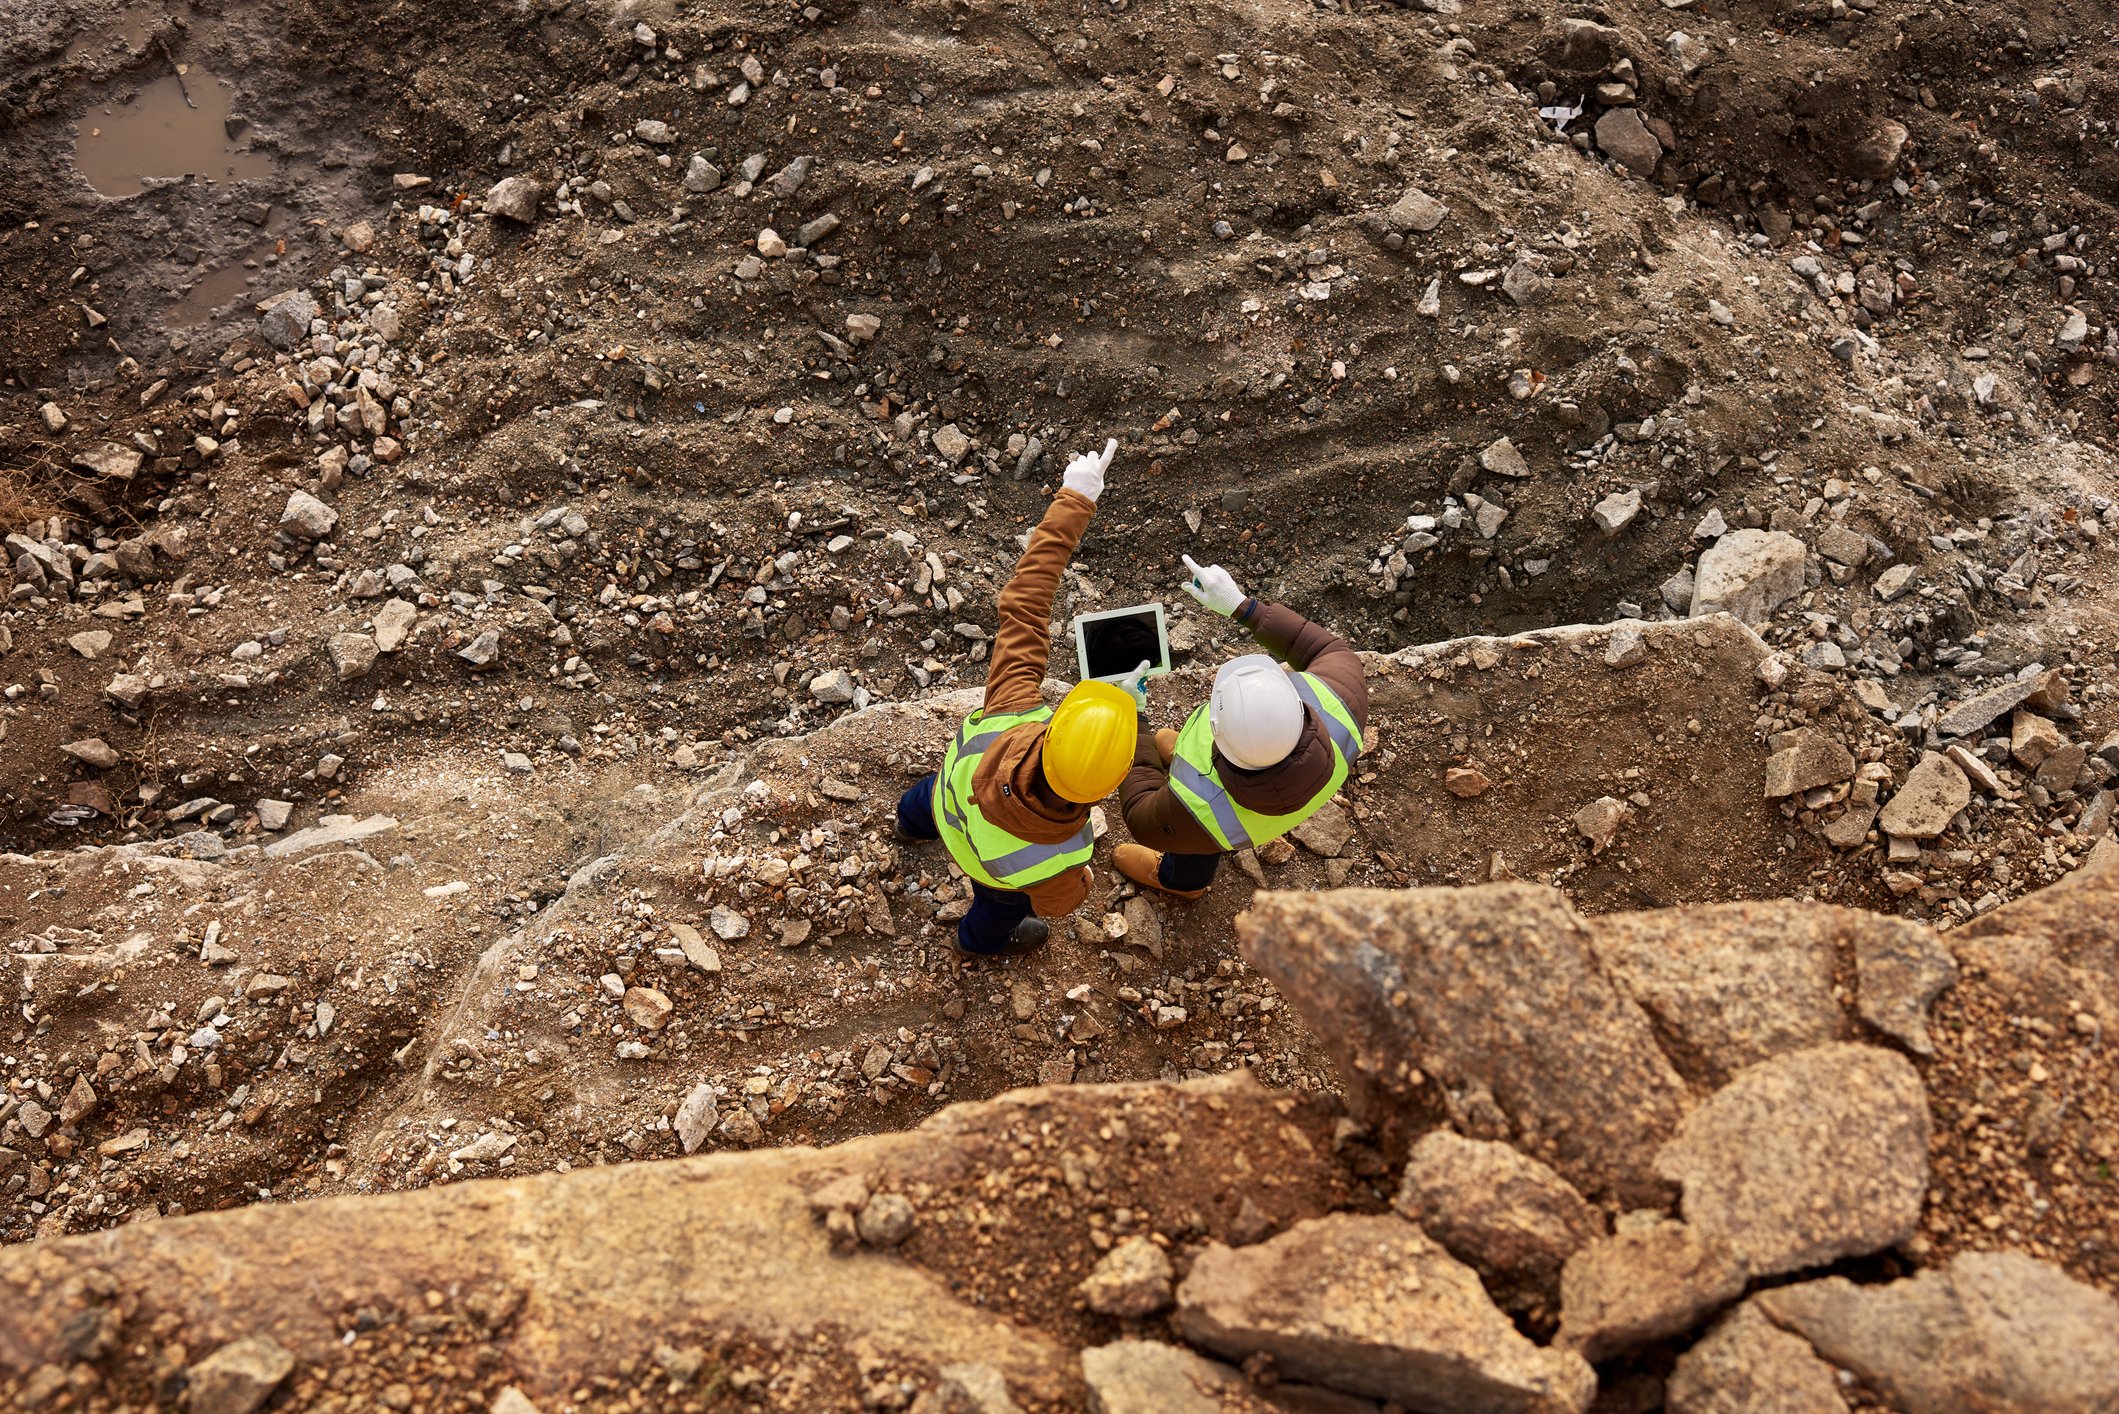
Hycroft looks for gold and silver in Nevada. It helps find metals needed for jewelry and technology. The company prepares its mine for future production.

Resources in the Ground

  • Gold Resources: Measured and indicated mineral resources totaling 16.4 million ounces in Nevada.
  • Silver Resources: Measured and indicated mineral resources totaling 562.6 million ounces across 70,671 acres.
  • Exploration Drilling: Active program to find high-grade metal zones using core drill rigs.
  • Technical Planning: Studies for Pressure Oxidation, which uses heat and pressure to release gold from complex rocks.

Strategic Moves in Nevada

  • Filed the 2026 Hycroft TRS in February 2026 to update mineral resource estimates.
  • Expanded the 2025-2026 Exploration Drill Program to target high-grade silver systems in the Brimstone and Vortex zones.
  • Reached an agreement to terminate the Crofoot Royalty for $2.5 million in January 2026 to reduce future costs.
  • Fully extinguished all remaining debt in October 2025 through a $125.5 million payment.

What Makes Hycroft Different

Hycroft manages one of the largest gold and silver deposits in the United States. Its debt-free balance sheet and high cash reserves provide stability for multi-year technical studies and exploration.

The Financial Scorecard

  • Net loss deepened to $48.3 million in Q1 2026, worsening by 310.6% from Q1 2025.
  • Operating loss reached $50.1 million in Q1 2026, a 442.9% decline year-over-year.
  • Unrestricted cash grew to $189 million by March 31, 2026, up from $181.7 million at the end of 2025.
  • Free cash flow hit negative $31.9 million in Q1 2026, worsening by 223.2% from the previous year.

Bottom Line

Hycroft has shifted from active mining to a technical and exploration phase focused on long-term development. By clearing its debt and funding drill programs, the company is positioning its Nevada assets for potential large-scale sulfide ore processing.

AI Generated • May 24, 2026

Industry

Metals and Mining

Sector

Materials

Employees

51

CEO

Diane Renee Garrett, PhD

Headquarters

Winnemucca, NV 89446, US

HYMC Financials

Key Financial Metrics (TTM)

Gross Margin

0.00%

Operating Margin

0.00%

Net Income Margin

0.00%

Return on Equity

-46.86%

Return on Capital

-20.81%

Return on Assets

-29.41%

Earnings Yield

-5.53%

Dividend Yield

0.00%

Payout Ratio

0.00%

Stock Overview

Market Cap

$1.82BMarket cap calculated using publicly traded shares outstanding only. Does not include unlisted, private, or dual-class non-traded shares. Implied market cap may vary.

Shares Outstanding

93.18M

Volume

1.06M

Avg. Volume

2.13M

Financials (TTM)

Gross Profit

$618.00K

Operating Income

-$98.60M

EBITDA

-$79.80M

Operating Cash Flow

-$108.22M

Capital Expenditure

-$1.01M

Free Cash Flow

-$109.23M

Cash & ST Invst.

$220.55M

Total Debt

$23.00K

Hycroft Mining Performance Analysis

Hycroft Mining annual revenue and year-over-year revenue growth by fiscal year
Fiscal yearPeriod endRevenueYoY growth
20222022-12-31USD 33,229,000-70.0%
20232023-12-31USD 0N/A
20242024-12-31USD 0N/A
20252025-12-31USD 0N/A
Hycroft Mining sequential (quarter-over-quarter) revenue growth by fiscal quarter
Fiscal quarterPeriod endQoQ growth
Q32025-09-30N/A
Q42025-12-31N/A
Q12026-03-31N/A
Q22026-06-30N/A
Hycroft Mining annual diluted earnings per share and year-over-year EPS growth by fiscal year
Fiscal yearPeriod endDiluted EPSYoY growth
20222022-12-31USD -3.58-75.7%
20232023-12-31USD -2.61-27.3%
20242024-12-31USD -2.630.8%
20252025-12-31USD -0.94-64.2%
Hycroft Mining sequential (quarter-over-quarter) diluted earnings per share growth by fiscal quarter
Fiscal quarterPeriod endQoQ growth
Q32025-09-3020.9%
Q42025-12-3172.4%
Q12026-03-31-475.7%
Q22026-06-3057.4%

Revenue Growth Rate

Annual and quarterly growth comparison

Earnings Per Share Growth Rate

Annual and quarterly EPS growth comparison

Quarterly Performance

Name
Q2 2026YOY CHG

Revenue

$0.00

N/A

Gross Profit

$5.13M

+261.7%

Gross Margin

0.00%

N/A

Market Cap

$1.82BMarket cap calculated using publicly traded shares outstanding only. Does not include unlisted, private, or dual-class non-traded shares. Implied market cap may vary.

N/A

Market Cap/Employee

$35.68M

N/A

Employees

51

N/A

Net Income

-$20.75M

-76.8%

EBITDA

-$20.45M

-161.6%

Quarterly Fundamentals

Name
Q2 2026YOY CHG

Total Cash

$220.55M

+215.6%

Total Debt

$23.00K

-100.0%

Accounts Receivable

$300.00K

+10.3%

Inventory

$1.60M

+22.0%

Long Term Debt

$0.00

-100.0%

Short Term Debt

$23.00K

-61.0%

Return on Assets

-29.41%

N/A

Return on Invested Capital

-34.31%

N/A

Free Cash Flow

-$13.02M

-40.8%

Operating Cash Flow

-$12.75M

-41.3%

Other Investments to Explore

People Also Watch

Symbol / CompanyPricePrice Chg
IPIIntrepid Potash, Inc.
$33.96-3.85%
OECOrion S.A.
$6.75-0.15%
CLWClearwater Paper Corporation
$21.03-0.57%
ODVOsisko Development Corp.
$2.28+1.33%

Trending Stocks

Symbol / CompanyPricePrice Chg
NVDANvidia
$200.75+0.03%
AAPLApple
$308.91-0.07%
AMZNAmazon
$271.58+0.15%
INTCIntel
$90.20-0.01%

Questions About HYMC

What is the current price of Hycroft Mining?

Hycroft Mining is trading at $19.53 per share.

What is the 52-week range for Hycroft Mining?

Over the past 52 weeks, Hycroft Mining has traded between $3.34 and $58.73.

How much debt does Hycroft Mining have?

As of the most recent reporting period, Hycroft Mining reported total debt of $23.00K.

How much cash does Hycroft Mining have on hand?

Hycroft Mining reported $220.55M in cash and cash equivalents in its most recent financial results.

What is Hycroft Mining’s dividend yield?

Hycroft Mining does not currently have a dividend yield.

Premium Investing Services

Invest better with The Motley Fool. Get stock recommendations, portfolio guidance, and more from The Motley Fool's premium services.