Accessibility Menu
Qualcomm logo

Qualcomm(NASDAQ) QCOM

Market Cap$168.24BMarket cap calculated using publicly traded shares outstanding only. Does not include unlisted, private, or dual-class non-traded shares. Implied market cap may vary.
Since IPO (1991)+46,339%
5 Year+27%
1 Year+6%
1 Month-5%
$161.95
+1.10%
+1.76Today
After hours$162.64+$0.69 (+0.43%)
Qualcomm last closing stock price
MetricPriceDate
Last closeUSD 161.912026-08-19
Qualcomm stock price return by period
PeriodPrice returnPrice at period startPeriod start date
1 week-0.71%USD 163.072026-08-12
1 month-4.94%USD 170.322026-07-20
3 month-23.85%USD 212.622026-05-21
Year to date-4.38%USD 169.332025-12-31
1 year+5.81%USD 153.022025-08-19
3 year+56.96%USD 103.162023-08-18
5 year+26.94%USD 127.552021-08-20
Since inception+46,339.22%USD 0.341991-12-13

Qualcomm Financials at a Glance

Market Cap

$168.24BMarket cap calculated using publicly traded shares outstanding only. Does not include unlisted, private, or dual-class non-traded shares. Implied market cap may vary.

Revenue (TTM)

$44.07B

Net Income (TTM)

$9.26B

EPS (TTM)

$8.64

P/E Ratio

18.54

Dividend

$3.59

Beta (Volatility)

1.61 (High)

Price

$161.95

Volume

8,099,520

Open

$163.03

Previous Close

$161.91

Daily Range

$160.19 - $166.50

52-Week Range

$121.99 - $259.92

Estimated Earnings Date

Nov 4, 2026

QCOM: Motley Fool Moneyball Superscore

77

Our CEO Is Handing Members His Secret Weapon

It's called Motley Fool Moneyball, our new proprietary AI tool

We spent over half a million dollars in R&D to build a tool that makes stock research faster, sharper, and smarter. Our analysts use it every day, and now, you can too.

Get Access Now

About Qualcomm

QUALCOMM Incorporated creates the technology that connects mobile devices. Its hardware helps cars and appliances link to wireless networks. These parts allow people to share data across the world.

What Powers Your Connection?

  • Handsets: Integrated circuits and software for mobile devices like smartphones; earned $5.1 billion in revenue in the third quarter of fiscal 2026.
  • Automotive: Digital cockpit and driver assistance systems for new vehicle launches; generated $1.6 billion in revenue in the third quarter of fiscal 2026.
  • Internet of Things (IoT): Chips for connected devices in homes and factories; brought in $1.8 billion in revenue in the third quarter of fiscal 2026.
  • Licensing: Patent rights for 4G and 5G wireless standards; earned $1.3 billion in revenue in the third quarter of fiscal 2026.

Expanding Beyond Smartphones

  • Acquired Alphawave in the first quarter of fiscal 2026 to strengthen its data center operations.
  • Launched digital cockpit and automated driving products to expand its presence in the automotive industry.
  • Replaced annual cash incentive awards with equity awards for the leadership team in fiscal 2026 to focus on long-term diversification.

Leading Through Innovation

Qualcomm maintains a portfolio of patents essential for global 5G and 4G wireless communication standards. The company invests in research to adapt mobile technology for use in cars and industrial machines.

The Financial Picture

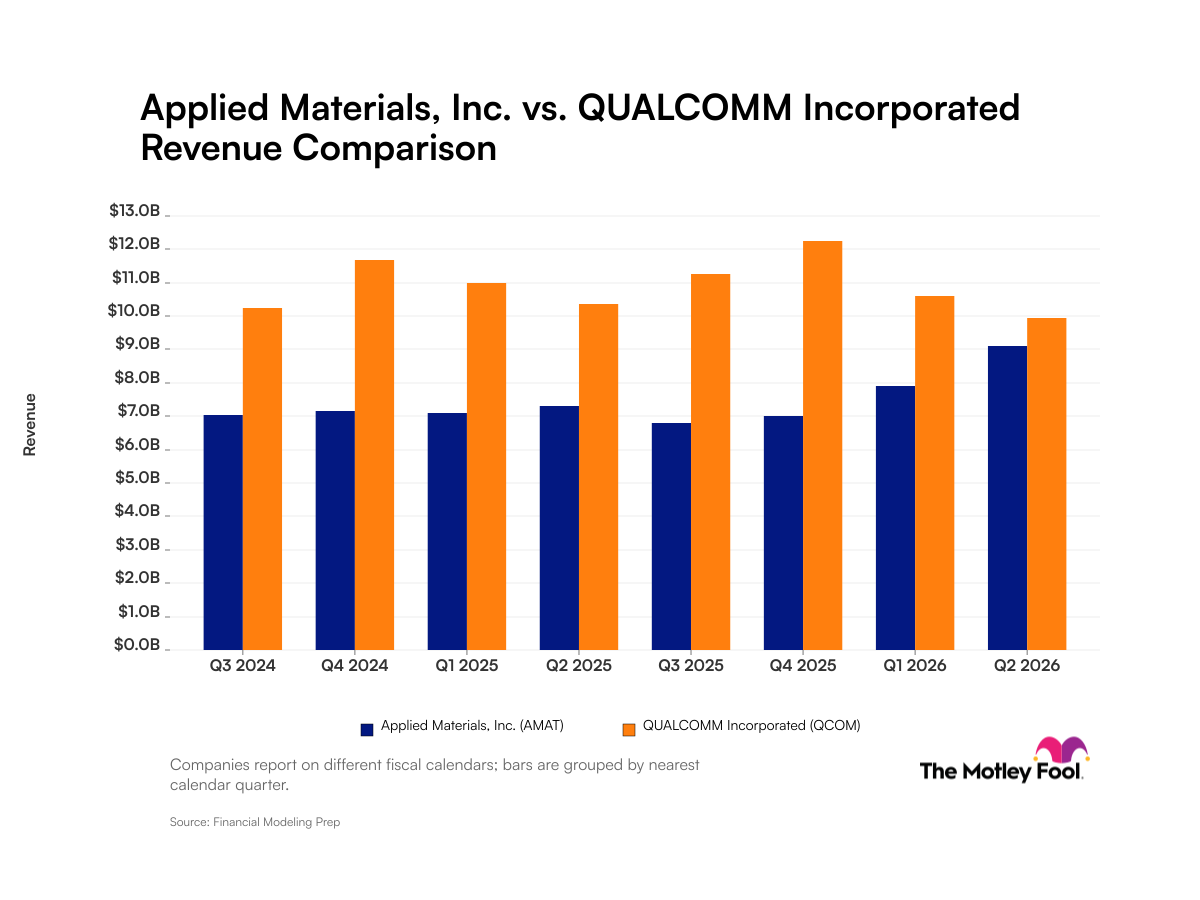
  • Total revenue was $9.9 billion in the third quarter of fiscal 2026, down 4% year over year.
  • Net income reached $2.0 billion in the third quarter of fiscal 2026, a 25% decrease year over year.
  • Research and development expenses were $2.6 billion in the third quarter of fiscal 2026.
  • The company held $8.3 billion in cash, cash equivalents, and marketable securities as of June 28, 2026.
  • Total debt stood at $15.3 billion as of June 28, 2026.

The Evolution of Connection

Qualcomm has moved from a mobile-focused chipmaker to a technology provider for automotive and industrial markets. Its growth depends on licensing its patent library while diversifying its hardware sales.

AI Generated • Aug 4, 2026

Industry

Semiconductors and Semiconductor Equipment

Employees

52,000

CEO

Cristiano R. Amon

Headquarters

San Diego, CA 92121-1714, US

QCOM Financials

Key Financial Metrics (TTM)

Gross Margin

54.23%

Operating Margin

23.19%

Net Income Margin

21.01%

Return on Equity

37.33%

Return on Capital

32.88%

Return on Assets

16.14%

Earnings Yield

5.39%

Dividend Yield

2.24%

Payout Ratio

41.31%

Stock Overview

Market Cap

$168.24BMarket cap calculated using publicly traded shares outstanding only. Does not include unlisted, private, or dual-class non-traded shares. Implied market cap may vary.

Shares Outstanding

1.05B

Volume

8.10M

Avg. Volume

17.43M

Financials (TTM)

Gross Profit

$23.90B

Operating Income

$10.22B

EBITDA

$13.47B

Operating Cash Flow

$12.40B

Capital Expenditure

-$1.99B

Free Cash Flow

$10.42B

Cash & ST Invst.

$8.30B

Total Debt

$15.27B

Qualcomm Performance Analysis

Qualcomm annual revenue and year-over-year revenue growth by fiscal year
Fiscal yearPeriod endRevenueYoY growth
20222022-09-30USD 44,200,000,00031.7%
20232023-09-30USD 35,820,000,000-19.0%
20242024-09-30USD 38,962,000,0008.8%
20252025-09-30USD 44,284,000,00013.7%
Qualcomm sequential (quarter-over-quarter) revenue growth by fiscal quarter
Fiscal quarterPeriod endQoQ growth
Q42025-09-288.7%
Q12025-12-288.7%
Q22026-03-29-13.5%
Q32026-06-28-6.2%
Qualcomm annual diluted earnings per share and year-over-year EPS growth by fiscal year
Fiscal yearPeriod endDiluted EPSYoY growth
20222022-09-30USD 11.3844.6%
20232023-09-30USD 6.42-43.5%
20242024-09-30USD 8.9839.7%
20252025-09-30USD 5.01-44.1%
Qualcomm sequential (quarter-over-quarter) diluted earnings per share growth by fiscal quarter
Fiscal quarterPeriod endQoQ growth
Q42025-09-28-214.0%
Q12025-12-28200.4%
Q22026-03-29147.5%
Q32026-06-28-72.8%

Revenue Growth Rate

Annual and quarterly growth comparison

Earnings Per Share Growth Rate

Annual and quarterly EPS growth comparison

Quarterly Performance

Name
Q3 2026YOY CHG

Revenue

$9.95B

-4.0%

Gross Profit

$5.28B

-8.4%

Gross Margin

53.05%

N/A

Market Cap

$168.24BMarket cap calculated using publicly traded shares outstanding only. Does not include unlisted, private, or dual-class non-traded shares. Implied market cap may vary.

N/A

Market Cap/Employee

$3.24M

N/A

Employees

52,000

N/A

Net Income

$2.00B

-24.9%

EBITDA

$3.04B

-18.8%

Quarterly Fundamentals

Name
Q3 2026YOY CHG

Total Cash

$8.30B

-17.1%

Total Debt

$15.27B

+3.3%

Accounts Receivable

$4.67B

+36.9%

Inventory

$8.38B

+32.2%

Long Term Debt

$12.78B

-13.6%

Short Term Debt

$2.49B

N/A

Return on Assets

16.14%

N/A

Return on Invested Capital

22.24%

N/A

Free Cash Flow

$495.00M

-80.8%

Operating Cash Flow

$991.00M

-65.5%

Other Investments to Explore

People Also Watch

Symbol / CompanyPricePrice Chg
UBERUber Technologies, Inc.
$78.04+4.53%
SONYSony Group Corporation
$23.49+0.26%
ANETArista Networks, Inc.
$186.45-3.48%
INTUIntuit Inc.
$362.47+3.44%

Trending Stocks

Symbol / CompanyPricePrice Chg
MRNAModerna
$174.38+1.77%
BITOProShares Trust - ProShares Bitcoin ETF
$9.25+0.06%
IBITiShares Bitcoin Trust
$38.78+0.06%
TSLLDirexion Shares ETF Trust - Direxion Daily Tsla Bull 2x ETF
$9.19+0.08%

Questions About QCOM

What is the current price of Qualcomm?

Qualcomm is trading at $161.91 per share.

What is the 52-week range for Qualcomm?

Over the past 52 weeks, Qualcomm has traded between $121.99 and $259.92.

How much debt does Qualcomm have?

As of the most recent reporting period, Qualcomm reported total debt of $15.27B.

How much cash does Qualcomm have on hand?

Qualcomm reported $4.53B in cash and cash equivalents in its most recent financial results.

What is Qualcomm’s dividend yield?

Qualcomm currently has a dividend yield of 2.24%.

Premium Investing Services

Invest better with The Motley Fool. Get stock recommendations, portfolio guidance, and more from The Motley Fool's premium services.