Accessibility Menu
Sunrun logo

Sunrun

(NASDAQ) RUN

Current Price$12.06
Market Cap$2.90BMarket cap calculated using publicly traded shares outstanding only. Does not include unlisted, private, or dual-class non-traded shares. Implied market cap may vary.
Since IPO (2015)+13%
5 Year-74%
1 Year+17%
1 Month-4%
Sunrun last closing stock price
MetricPriceDate
Last closeUSD 12.142026-07-16
Sunrun stock price return by period
PeriodPrice returnPrice at period startPeriod start date
1 week-2.57%USD 12.462026-07-09
1 month-3.96%USD 12.642026-06-16
3 month-2.1%USD 12.402026-04-17
Year to date-34.02%USD 18.402025-12-31
1 year+17.41%USD 10.342025-07-16
3 year-44.39%USD 21.832023-07-17
5 year-73.81%USD 46.352021-07-16
Since inception+12.72%USD 10.772015-08-05

Sunrun Financials at a Glance

Market Cap

$2.90BMarket cap calculated using publicly traded shares outstanding only. Does not include unlisted, private, or dual-class non-traded shares. Implied market cap may vary.

Revenue (TTM)

$3.17B

Net Income (TTM)

$568.20M

EPS (TTM)

$2.14

P/E Ratio

5.68

Dividend

$0.00

Beta (Volatility)

1.98 (High)

Price

$12.06

Volume

43,002

Open

$11.93

Previous Close

$12.14

Daily Range

$11.81 - $12.16

52-Week Range

$9.01 - $22.44

Estimated Earnings Date

Aug 5, 2026

RUN: Motley Fool Moneyball Superscore

61

Our CEO Is Handing Members His Secret Weapon

It's called Motley Fool Moneyball, our new proprietary AI tool

We spent over half a million dollars in R&D to build a tool that makes stock research faster, sharper, and smarter. Our analysts use it every day, and now, you can too.

Get Access Now

About Sunrun

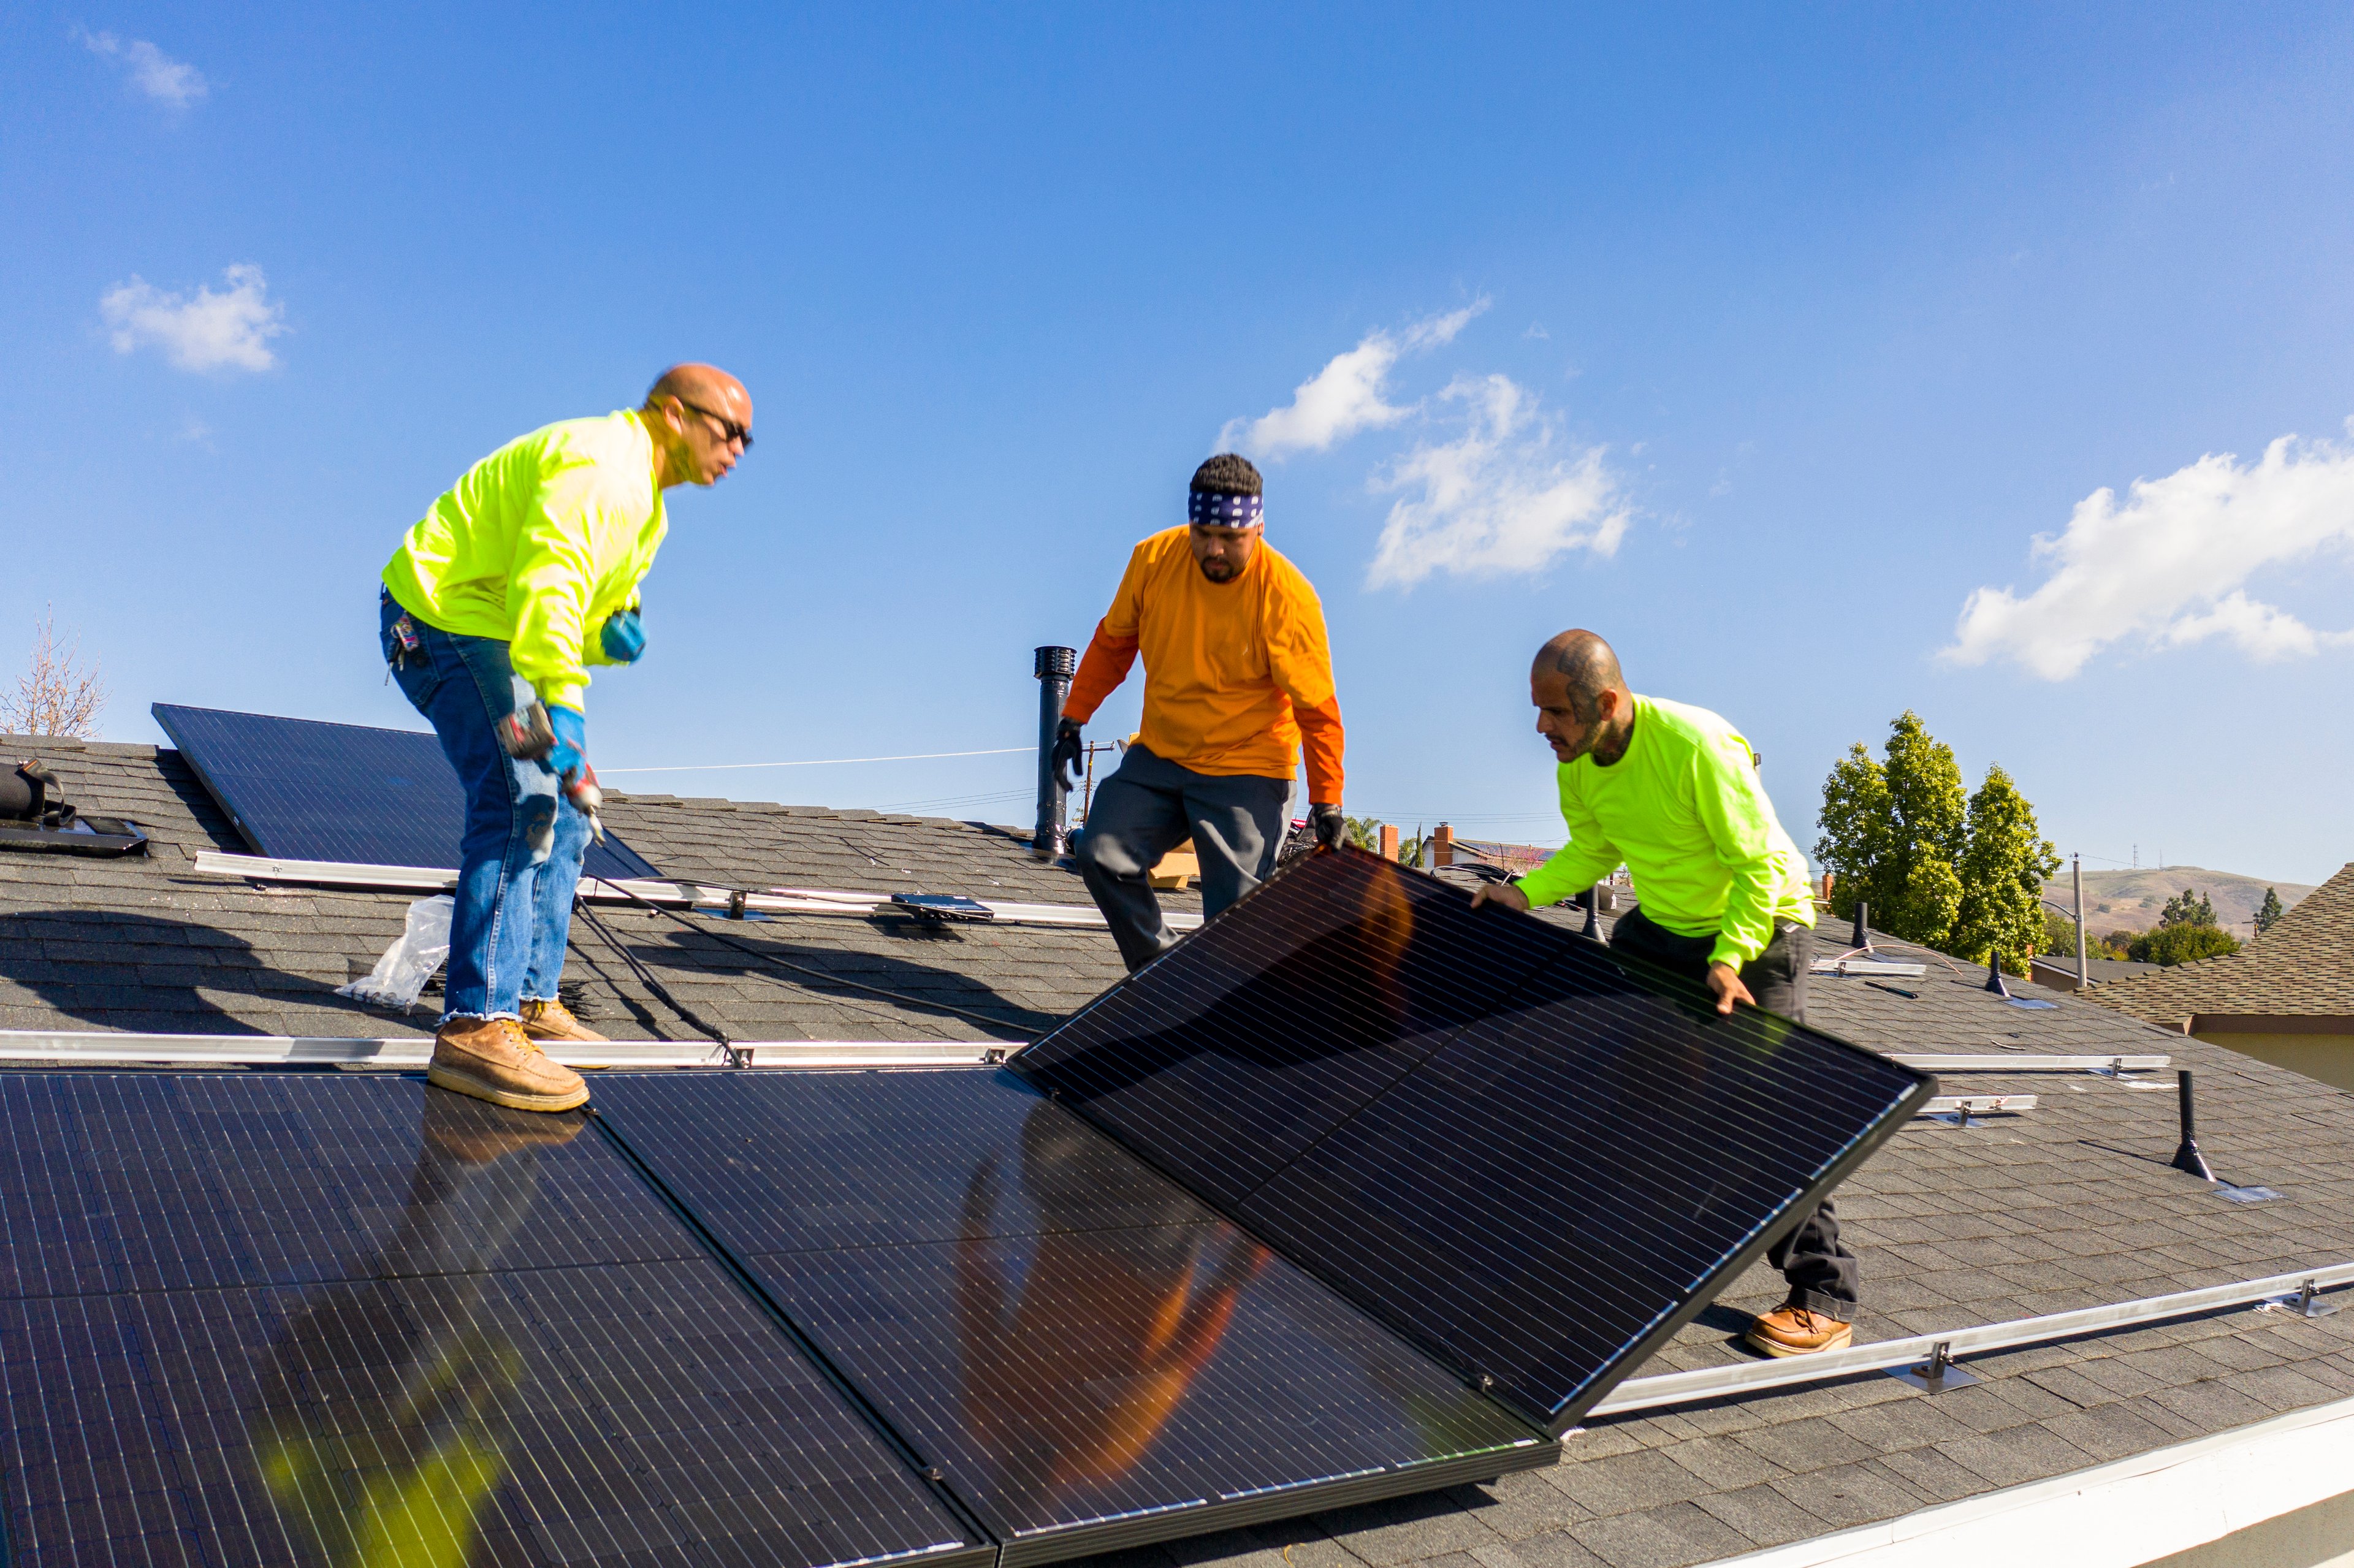
Sunrun helps homeowners put solar panels on their houses. These systems let families make their own clean electricity. The company also sets up batteries to store extra power.

Powering the Modern Home

  • Customer Agreements: Long-term contracts where homeowners pay for energy or equipment access; generated $467.8 million in Q1 2026.
  • Energy Systems: Direct sales of solar panels and batteries to residential customers who want to own their hardware.
  • Product Sales: Sale of solar components like panels, inverters, and racks to resellers and other solar businesses.
  • Grid Services: Programs where home battery systems share stored power with the local electricity grid to support reliability.
  • Lead Generation: Business of finding potential new customers and selling their contact information to solar partners.

Scaling Up Clean Energy

  • Strategic Partnerships: Works with a network of solar and strategic partners to reach more residential customers across the United States.
  • Tax Equity Funds: Uses special investment structures to raise capital from outside investors to pay for new solar projects.
  • Electrification Expansion: Expanded offerings to include home-to-grid power plants and home-to-grid power products that manage energy flow.

What Makes Sunrun Different?

Sunrun uses a direct-to-consumer approach through online channels, retail stores, and field marketing to reach homeowners. It manages a large fleet of systems that usually stay under contract for 20 to 25 years.

The Q1 2026 Scorecard

  • Total revenue reached $722.2 million in Q1 2026, up 43.2% from $504.3 million in Q1 2025.
  • Gross profit hit $219.8 million in Q1 2026, an increase of 122.4% year-over-year.
  • Net income attributable to common stockholders was $167.6 million in Q1 2026, up 235.2% from $50.0 million in Q1 2025.
  • Operating cash flow turned positive at $10.6 million in Q1 2026, compared to a $104.2 million loss a year earlier.
  • Free cash flow was negative $414.2 million in Q1 2026, narrowing from a $759.2 million loss in Q1 2025.

The Final Word

Sunrun has moved beyond simple solar installation to become a large-scale provider of residential energy and storage. Its focus on long-term customer contracts and battery storage supports its growth in the clean energy market.

AI Generated • May 23, 2026

Industry

Electrical Equipment

Employees

9,059

CEO

Mary G. Powell

Headquarters

San Francisco, CA 94104, US

RUN Financials

Key Financial Metrics (TTM)

Gross Margin

30.44%

Operating Margin

-1.79%

Net Income Margin

17.90%

Return on Equity

18.35%

Return on Capital

-0.70%

Return on Assets

2.50%

Earnings Yield

17.61%

Dividend Yield

0.00%

Payout Ratio

0.00%

Stock Overview

Market Cap

$2.90BMarket cap calculated using publicly traded shares outstanding only. Does not include unlisted, private, or dual-class non-traded shares. Implied market cap may vary.

Shares Outstanding

238.55M

Volume

43.00K

Avg. Volume

9.90M

Financials (TTM)

Gross Profit

$966.56M

Operating Income

-$56.85M

EBITDA

$750.95M

Operating Cash Flow

-$306.61M

Capital Expenditure

-$443.96M

Free Cash Flow

-$750.57M

Cash & ST Invst.

$679.55M

Total Debt

$14.87B

Sunrun Performance Analysis

Sunrun annual revenue and year-over-year revenue growth by fiscal year
Fiscal yearPeriod endRevenueYoY growth
20222022-12-31USD 2,321,422,00044.2%
20232023-12-31USD 2,259,813,000-2.7%
20242024-12-31USD 2,037,719,000-9.8%
20252025-12-31USD 2,956,997,00045.1%
Sunrun sequential (quarter-over-quarter) revenue growth by fiscal quarter
Fiscal quarterPeriod endQoQ growth
Q22025-06-3012.9%
Q32025-09-3027.3%
Q42025-12-3159.9%
Q12026-03-31-37.7%
Sunrun annual diluted earnings per share and year-over-year EPS growth by fiscal year
Fiscal yearPeriod endDiluted EPSYoY growth
20222022-12-31USD 0.79N/A
20232023-12-31USD -7.41N/A
20242024-12-31USD -12.8172.9%
20252025-12-31USD 1.71N/A
Sunrun sequential (quarter-over-quarter) diluted earnings per share growth by fiscal quarter
Fiscal quarterPeriod endQoQ growth
Q22025-06-30435.0%
Q32025-09-30-94.4%
Q42025-12-31533.3%
Q12026-03-3163.2%

Revenue Growth Rate

Annual and quarterly growth comparison

Earnings Per Share Growth Rate

Annual and quarterly EPS growth comparison

Quarterly Performance

Name
Q1 2026YOY CHG

Revenue

$722.23M

+43.2%

Gross Profit

$219.80M

+122.4%

Gross Margin

30.43%

N/A

Market Cap

$2.90BMarket cap calculated using publicly traded shares outstanding only. Does not include unlisted, private, or dual-class non-traded shares. Implied market cap may vary.

N/A

Market Cap/Employee

$319.68K

N/A

Employees

9,059

N/A

Net Income

$167.64M

+235.2%

EBITDA

$163.23M

+1599.8%

Quarterly Fundamentals

Name
Q1 2026YOY CHG

Total Cash

$679.55M

+12.3%

Total Debt

$14.87B

+8.8%

Accounts Receivable

$232.51M

+35.1%

Inventory

$490.39M

+18.3%

Long Term Debt

$14.53B

+8.7%

Short Term Debt

$339.37M

+11.5%

Return on Assets

2.50%

N/A

Return on Invested Capital

-0.27%

N/A

Free Cash Flow

-$414.21M

+45.4%

Operating Cash Flow

$10.62M

+110.2%

Other Investments to Explore

People Also Watch

Symbol / CompanyPricePrice Chg
SEDGSolarEdge Technologies, Inc.
$52.31-0.06%
CNRCore Natural Resources, Inc.
$84.06+0.56%
CNXCNX Resources Corporation
$34.05+1.76%
VVVValvoline Inc.
$40.68+1.01%

Trending Stocks

Symbol / CompanyPricePrice Chg
TQQQProShares Trust - ProShares UltraPro Qqq
$65.47-0.07%
MUUDirexion Shares ETF Trust - Direxion Daily Mu Bull 2x Shares
$25.46-0.07%
TSLLDirexion Shares ETF Trust - Direxion Daily Tsla Bull 2x Shares
$11.30-0.06%
QQQInvesco QQQ Trust
$688.62-0.02%

Questions About RUN

What is the current price of Sunrun?

Sunrun is trading at $12.06 per share.

What is the 52-week range for Sunrun?

Over the past 52 weeks, Sunrun has traded between $9.01 and $22.44.

How much debt does Sunrun have?

As of the most recent reporting period, Sunrun reported total debt of $14.87B.

How much cash does Sunrun have on hand?

Sunrun reported $1.09B in cash and cash equivalents in its most recent financial results.

What is Sunrun’s dividend yield?

Sunrun does not currently have a dividend yield.

Premium Investing Services

Invest better with The Motley Fool. Get stock recommendations, portfolio guidance, and more from The Motley Fool's premium services.