
Banco Bilbao Vizcaya Argentaria
(NYSE) BBVA
Banco Bilbao Vizcaya Argentaria Financials at a Glance
Market Cap
$119.19B
Revenue (TTM)
$47.06B
Net Income (TTM)
$10.80B
EPS (TTM)
$2.19
P/E Ratio
9.78
Dividend
$1.07
Beta (Volatility)
1.01 (Average)
Dividend
$1.07
Beta (Volatility)
1.01 (Average)
Price
$22.16
Volume
962,665
Open
$22.14
Price
$22.16
Volume
962,665
Open
$22.14
Previous Close
$22.16
Daily Range
$22.05 - $22.23
52-Week Range
$14.12 - $26.20
Dividend
$1.07
Beta (Volatility)
1.01 (Average)
Price
$22.16
Volume
962,665
Open
$22.14
Previous Close
$22.16
Daily Range
$22.05 - $22.23
52-Week Range
$14.12 - $26.20
BBVA News
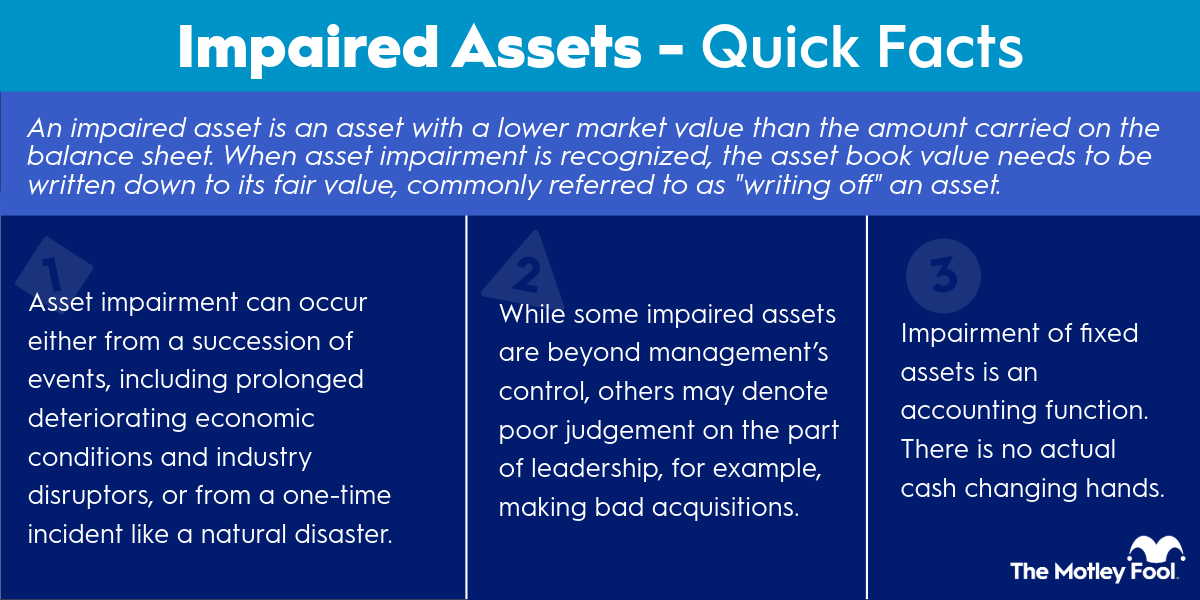
What Is an Impaired Asset?


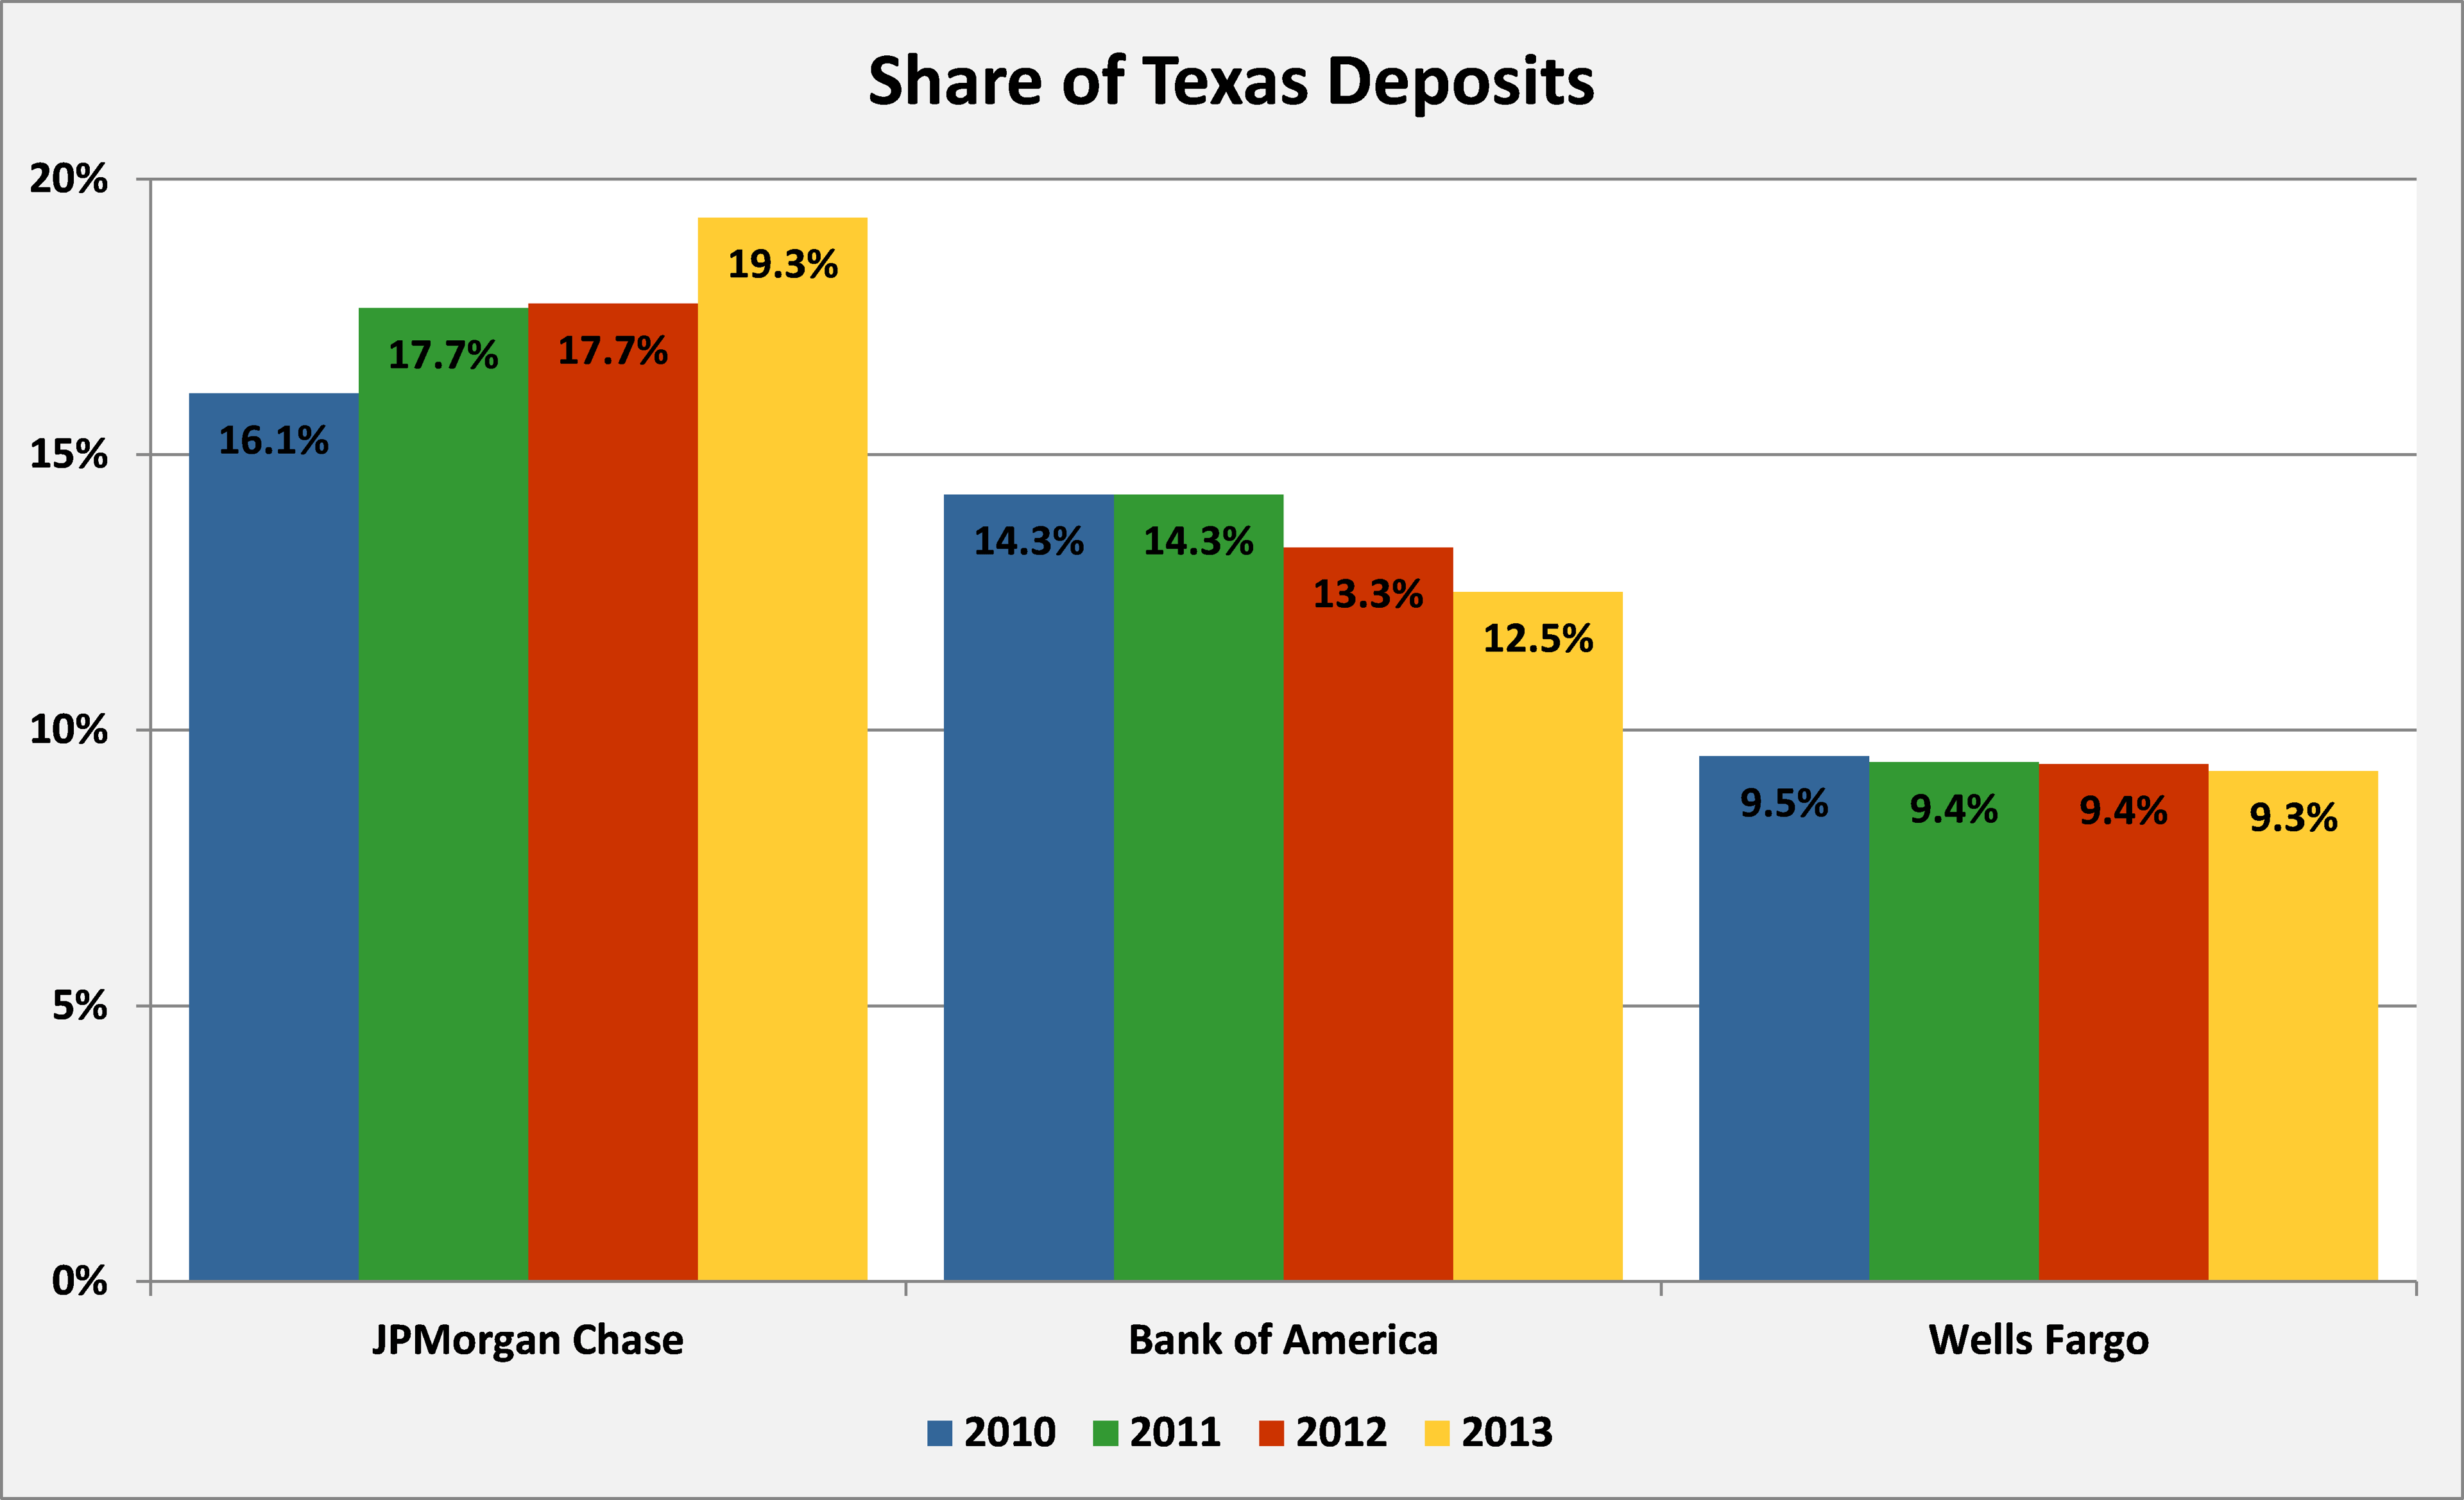
These 3 Regional Banks Rule Texas
BBVA: Motley Fool Moneyball Superscore
Our CEO Is Handing Members His Secret Weapon
It's called Motley Fool Moneyball, our new proprietary AI tool
We spent over half a million dollars in R&D to build a tool that makes stock research faster, sharper, and smarter. Our analysts use it every day, and now, you can too.
Get Access NowAbout Banco Bilbao Vizcaya Argentaria
Industry
Banks
Sector
FinancialsEmployees
126,877
CEO
Onur Genç, MBA
Website
www.bbva.comHeadquarters
Bilbao, 48005, ES
BBVA Financials
Key Financial Metrics (TTM)
Gross Margin
83%
Operating Margin
43%
Net Income Margin
28%
Return on Equity
20%
Return on Capital
7%
Return on Assets
1%
Earnings Yield
10.22%
Dividend Yield
5.01%
Payout Ratio
38.84%
Stock Overview
Market Cap
$119.19B
Shares Outstanding
5.57B
Volume
962.66K
Avg. Volume
2.15M
Financials (TTM)
Gross Profit
$30.86B
Operating Income
$16.23B
EBITDA
$17.75B
Operating Cash Flow
$14.97B
Capital Expenditure
$1.81B
Free Cash Flow
$13.16B
Cash & ST Invst.
$275.94B
Total Debt
$81.84B
Banco Bilbao Vizcaya Argentaria Performance Analysis
Revenue Growth Rate
Annual and quarterly growth comparisonEarnings Per Share Growth Rate
Annual and quarterly EPS growth comparisonQuarterly Performance
Revenue
$10.65B
+14.2%
Gross Profit
$8.83B
+2406.0%
Gross Margin
82.91%
N/A
Market Cap
$119.19B
N/A
Market Cap/Employee
$955.46K
N/A
Employees
124,741
N/A
Net Income
$2.99B
+10.8%
EBITDA
$5.14B
+8.8%
Quarterly Fundamentals
Net Cash
$198.79B
+41.1%
Accounts Receivable
$0.00
N/A
Inventory
$0.00
N/A
Long Term Debt
$87.56B
+19.2%
Short Term Debt
$0.00
-100.0%
Return on Assets
1.21%
N/A
Return on Invested Capital
6.97%
N/A
Free Cash Flow
$3.31B
+146.9%
Operating Cash Flow
$4.01B
+159.8%