Bloom Energy logo

Bloom Energy(NYSE) BE

Market Cap$56.93BMarket cap calculated using publicly traded shares outstanding only. Does not include unlisted, private, or dual-class non-traded shares. Implied market cap may vary.
Since IPO (2018)+673%
5 Year+857%
1 Year+91%
1 Month-30%
Premium Feature
Moneyball Superscore
80/100
$203.93
+5.50%
+10.63Today
After hours$205.84+$1.91 (+0.94%)
Bloom Energy last closing stock price
MetricPriceDate
Last closeUSD 193.302026-10-23
Bloom Energy stock price return by period
PeriodPrice returnPrice at period startPeriod start date
1 week-12.66%USD 221.312026-10-16
1 month-29.76%USD 275.192026-09-23
3 month+4.55%USD 184.892026-07-24
Year to date+122.47%USD 86.892025-12-31
1 year+90.59%USD 101.422025-10-23
3 year+1,545.11%USD 11.752023-10-24
5 year+857.4%USD 20.192021-10-22
Since inception+673.2%USD 25.002018-07-25

Bloom Energy Financials at a Glance

Market Cap

$56.93BMarket cap calculated using publicly traded shares outstanding only. Does not include unlisted, private, or dual-class non-traded shares. Implied market cap may vary.

Revenue (TTM)

$3.83B

Net Income (TTM)

$518.31M

EPS (TTM)

$1.61

P/E Ratio

119.70

Dividend

$0.00

Beta (Volatility)

2.27 (High)

Price

$203.93

Volume

20,505,298.979

Open

$193.00

Previous Close

$203.92

Daily Range

$192.15 - $210.86

52-Week Range

$75.70 - $351.28

Estimated Earnings Date

Feb 4, 2027

About Bloom Energy

Bloom Energy NYSE:BE makes power systems that create electricity on-site. These machines help hospitals and data centers stay running without combustion. The technology uses chemistry to turn fuel into clean, reliable power.

Energy for the Digital Era

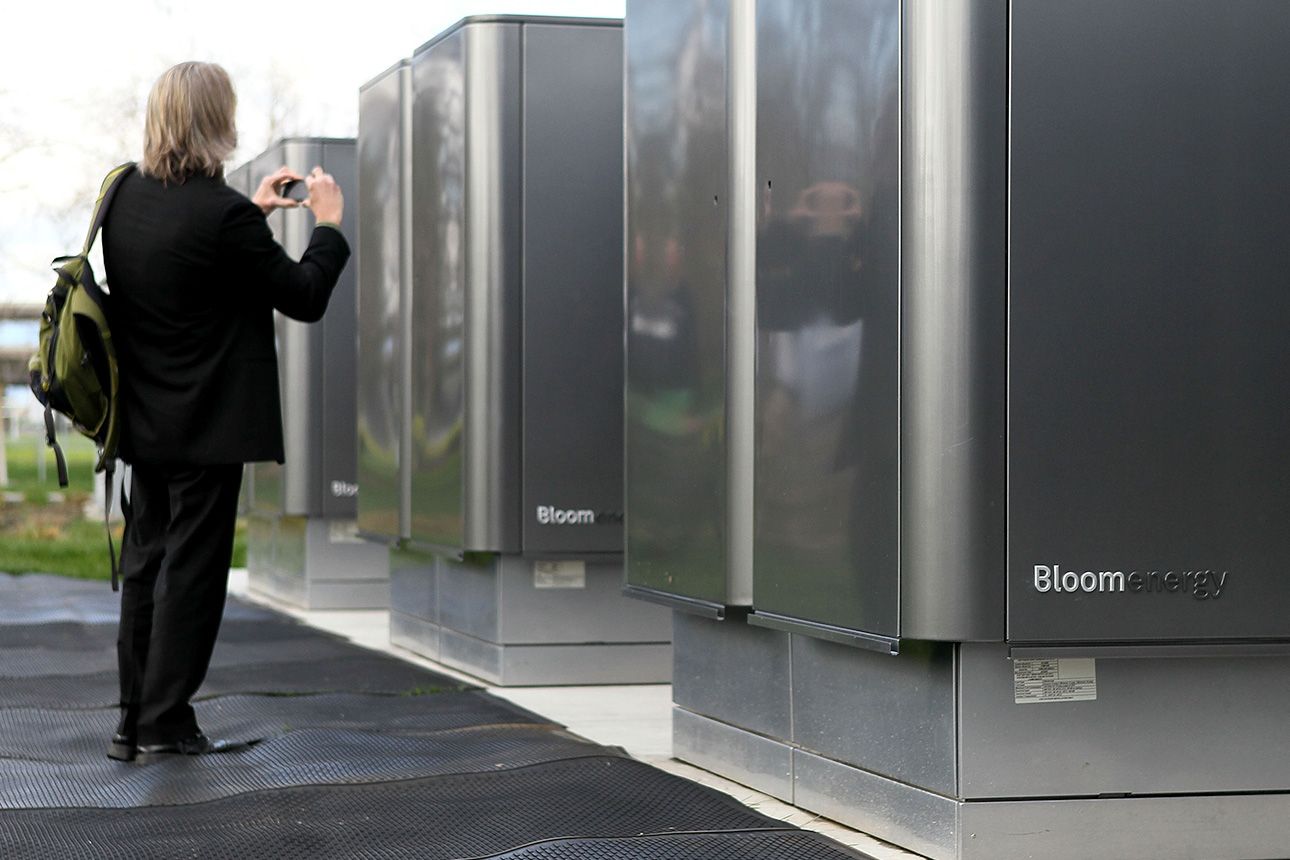
  • Energy Server: Converts fuels such as natural gas, biogas, and hydrogen into electricity through a chemical process; achieves high efficiency without moving parts or combustion.
  • Bloom Electrolyzer: Produces hydrogen for industrial and energy applications; designed to support the global shift toward cleaner fuels.
  • Installation and Service: Includes professional setup and long-term maintenance contracts for the installed fleet; focuses on ensuring performance and efficiency for customers.

Strategic Alliances and Growth

  • Partnered with Oracle in Oct. 2025 to provide on-site power for artificial intelligence data centers.
  • Issued a warrant to Oracle in April 2026 that resulted in the issuance of 1.9 million shares through a cashless exercise.
  • Opened an engineering and manufacturing facility in Fremont, California, in July 2022 to increase production capacity.
  • Entered joint venture structures with Brookfield Asset Management in 2025 to fund clean energy projects.

Clean Power Technology

Bloom uses solid-oxide technology to turn fuel into electricity without burning it. This electrochemical process provides reliable power to data centers and hospitals while reducing pollutants compared to traditional grid sources. The company has also expanded into hydrogen production to support the global energy transition.

Revenue Surges 144.9% on AI Demand

  • Total revenue reached $3.1 billion for the nine months ended Sept. 30, 2026, up 144.9% year over year.
  • Product revenue was $2.7 billion for the nine months ended Sept. 30, 2026, up 198.2% year over year.
  • Unrestricted cash and cash equivalents totaled $2.5 billion as of Sept. 30, 2026.
  • Net cash provided by operating activities was $272.9 million for the nine months ended Sept. 30, 2026.

Evolution of Energy

Bloom Energy has moved from developing fuel cells to supplying power for the large artificial intelligence market. Its transition to third-party installations and hydrogen technology shows how the company adapts to new energy needs.

AI Generated • Oct 23, 2026

Industry

Electrical Equipment

Employees

2,214

CEO

K. R. Sridhar, PhD

Headquarters

San Jose, CA 95134, US

BE Financials

Key Financial Metrics (TTM)

Gross Margin

32.33%

Operating Margin

14.81%

Net Income Margin

13.53%

Return on Equity

39.60%

Return on Capital

1.94%

Return on Assets

7.89%

Earnings Yield

0.84%

Dividend Yield

0.00%

Payout Ratio

0.18%

Stock Overview

Market Cap

$56.93BMarket cap calculated using publicly traded shares outstanding only. Does not include unlisted, private, or dual-class non-traded shares. Implied market cap may vary.

Shares Outstanding

294.53M

Volume

20.51M

Avg. Volume

16.07M

Financials (TTM)

Gross Profit

$1.24B

Operating Income

$567.41M

EBITDA

$616.33M

Operating Cash Flow

$694.34M

Capital Expenditure

-$254.17M

Free Cash Flow

$440.16M

Cash & ST Invst.

$2.49B

Total Debt

$2.78B

Bloom Energy Performance Analysis

Bloom Energy annual revenue and year-over-year revenue growth by fiscal year
Fiscal yearPeriod endRevenueYoY growth
20222022-12-31USD 1,199,125,00023.3%
20232023-12-31USD 1,333,470,00011.2%
20242024-12-31USD 1,473,856,00010.5%
20252025-12-31USD 2,023,994,00037.3%
Bloom Energy sequential (quarter-over-quarter) revenue growth by fiscal quarter
Fiscal quarterPeriod endQoQ growth
Q42025-12-3149.8%
Q12026-03-31-3.4%
Q22026-06-3041.8%
Q32026-09-3016.0%
Bloom Energy annual diluted earnings per share and year-over-year EPS growth by fiscal year
Fiscal yearPeriod endDiluted EPSYoY growth
20222022-12-31USD -1.6271.0%
20232023-12-31USD -1.42-12.4%
20242024-12-31USD -0.13-90.9%
20252025-12-31USD -0.37186.1%
Bloom Energy sequential (quarter-over-quarter) diluted earnings per share growth by fiscal quarter
Fiscal quarterPeriod endQoQ growth
Q42025-12-31104.2%
Q12026-03-315509.8%
Q22026-06-30169.6%
Q32026-09-3025.8%

Revenue Growth Rate

Annual and quarterly growth comparison

Earnings Per Share Growth Rate

Annual and quarterly EPS growth comparison

Quarterly Performance

Name
Q3 2026YOY CHG

Revenue

$1.24B

+138.1%

Gross Profit

$417.10M

+175.0%

Gross Margin

33.75%

N/A

Market Cap

$56.93BMarket cap calculated using publicly traded shares outstanding only. Does not include unlisted, private, or dual-class non-traded shares. Implied market cap may vary.

N/A

Market Cap/Employee

$25.71M

N/A

Employees

2,214

N/A

Net Income

$250.27M

+1183.8%

EBITDA

$271.12M

+5837.9%

Quarterly Fundamentals

Name
Q3 2026YOY CHG

Total Cash

$2.49B

+317.9%

Total Debt

$2.78B

+83.8%

Accounts Receivable

$634.74M

-6.9%

Inventory

$927.67M

+31.6%

Long Term Debt

$2.71B

+86.7%

Short Term Debt

$69.76M

+15.2%

Return on Assets

7.89%

N/A

Return on Invested Capital

10.95%

N/A

Free Cash Flow

-$180.63M

-2551.6%

Operating Cash Flow

-$27.15M

-238.0%

Other Investments to Explore

People Also Watch

Symbol / CompanyPricePrice Chg
PLUGPlug Power Inc.
$1.37-0.72%
FCELFuelCell Energy, Inc.
$11.46+3.15%
BLDPBallard Power Systems Inc.
$1.43-2.72%

Trending Stocks

Symbol / CompanyPricePrice Chg
NUNu Holdings
$12.59-16.95%
EWZiShares - iShares Msci Brazil ETF
$34.15-19.82%
ITUBItaú Unibanco
$7.70-20.37%
XPXP
$15.71-48.36%

Questions About BE

What is the current price of Bloom Energy?

Bloom Energy is trading at $203.92 per share.

What is the 52-week range for Bloom Energy?

Over the past 52 weeks, Bloom Energy has traded between $75.70 and $351.28.

How much debt does Bloom Energy have?

As of the most recent reporting period, Bloom Energy reported total debt of $2.79B.

How much cash does Bloom Energy have on hand?

Bloom Energy reported $2.49B in cash and cash equivalents in its most recent financial results.

What is Bloom Energy’s dividend yield?

Bloom Energy does not currently have a dividend yield.

Premium Investing Services

Invest better with The Motley Fool. Get stock recommendations, portfolio guidance, and more from The Motley Fool's premium services.