Accessibility Menu
Invesco logo

Invesco(NYSE) IVZ

Current Price$29.91
Market Cap$13.27BMarket cap calculated using publicly traded shares outstanding only. Does not include unlisted, private, or dual-class non-traded shares. Implied market cap may vary.
Since IPO (1995)+772%
5 Year+49%
1 Year+45%
1 Month+15%
Invesco last closing stock price
MetricPriceDate
Last closeUSD 29.932026-07-24
Invesco stock price return by period
PeriodPrice returnPrice at period startPeriod start date
1 week+1.01%USD 29.632026-07-17
1 month+15.25%USD 25.972026-06-24
3 month+18.24%USD 25.312026-04-24
Year to date+15.75%USD 25.862025-12-31
1 year+44.56%USD 20.702025-07-24
3 year+106.43%USD 14.502023-07-25
5 year+48.94%USD 20.102021-07-23
Since inception+771.67%USD 3.431995-08-25

Invesco Financials at a Glance

Market Cap

$13.27BMarket cap calculated using publicly traded shares outstanding only. Does not include unlisted, private, or dual-class non-traded shares. Implied market cap may vary.

Revenue (TTM)

$6.59B

Net Income (TTM)

-$243.40M

EPS (TTM)

-$1.49

P/E Ratio

-20.14

Dividend

$0.85

Beta (Volatility)

1.49 (Average)

Price

$29.91

Volume

135

Open

$30.06

Previous Close

$29.93

Daily Range

$29.81 - $30.37

52-Week Range

$20.08 - $31.02

Estimated Earnings Date

Jul 28, 2026

IVZ: Motley Fool Moneyball Superscore

64

Our CEO Is Handing Members His Secret Weapon

It's called Motley Fool Moneyball, our new proprietary AI tool

We spent over half a million dollars in R&D to build a tool that makes stock research faster, sharper, and smarter. Our analysts use it every day, and now, you can too.

Get Access Now

About Invesco

Invesco helps people and businesses grow their wealth by managing their money in various funds. It works with everyone from individual savers to large global institutions. The firm provides many ways to invest in markets like stocks and bonds around the world.

The Investment Menu

  • Exchange-Traded Funds (ETFs) and Indexing: Passive investment tools that follow specific market lists; the QQQ fund alone held $407 billion as of December 31, 2025.
  • Fundamental Equities and Fixed Income: Stock and bond portfolios managed by experts who pick specific investments; combined for $610 billion in assets as of December 31, 2025.
  • Private Markets: Investments in real estate and private credit for clients seeking options outside of public stock markets.
  • Global Liquidity: Money market funds and cash-like tools used by large companies to manage their daily savings.
  • China Joint Venture: Investment services provided through Invesco Great Wall, which managed $132 billion as of late 2025.

New Paths for Growth

  • Launched the Alpha/Hybrid investment platform to improve how the company manages data and makes trades.
  • Expanded retail reach by using digital platforms and exploring tokenization, which lets investors buy small fractions of assets.
  • Prioritized high-demand areas like private markets and ETFs to match the global shift toward passive and alternative investing.
  • Developed specialized investment teams in more than 20 countries to better serve local clients in their own regions.

What Makes Invesco Different

Invesco operates as an independent manager, which helps it avoid the conflicts of interest found at banks that both create and sell products. Its global footprint allows it to serve clients in over 120 countries through a wide variety of investment styles.

The Financial Scorecard

  • Revenue grew to $1.7 billion in Q4 2025, a 6.2% increase from the previous year.
  • Gross profit rose to $1.1 billion in Q4 2025, up 88% from Q4 2024.
  • Assets under management reached $2.2 trillion by December 31, 2025.
  • Free cash flow climbed to $510 million in Q4 2025, up 57.5% year-over-year.
  • The company recorded a $1.8 billion non-cash impairment charge in 2025 related to the value of its U.S. retail mutual fund contracts.

Evolution at a Glance

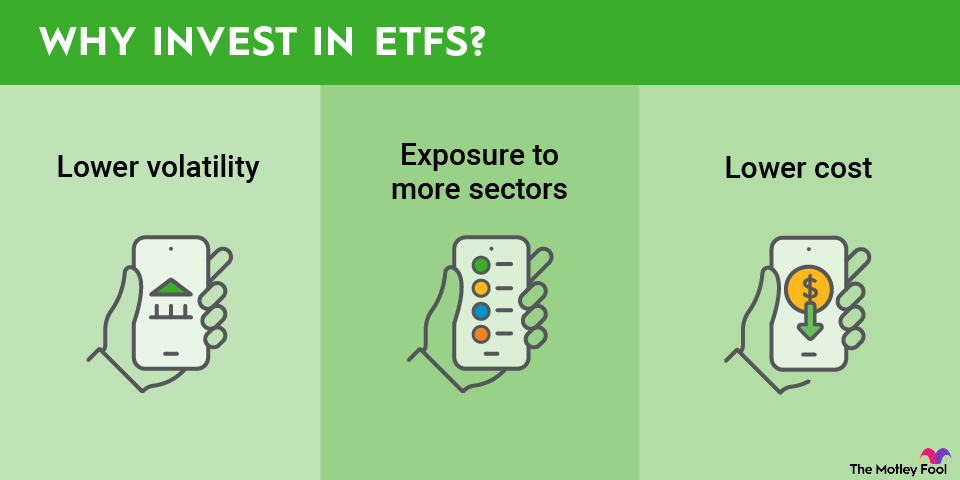
Invesco has transitioned from a traditional stock picker into a diversified giant with a heavy focus on ETFs and private markets. This shift helps the firm stay relevant as investors move away from expensive, actively managed funds toward lower-cost and specialized options.

AI Generated • Apr 21, 2026

Industry

Capital Markets

Employees

7,499

CEO

Andrew Ryan Schlossberg, MBA

Headquarters

Atlanta, GA 30309, US

IVZ Financials

Key Financial Metrics (TTM)

Gross Margin

50.68%

Operating Margin

-9.71%

Net Income Margin

-3.69%

Return on Equity

-1.86%

Return on Capital

-3.11%

Return on Assets

-0.91%

Earnings Yield

-4.97%

Dividend Yield

2.82%

Payout Ratio

-2.32%

Stock Overview

Market Cap

$13.27BMarket cap calculated using publicly traded shares outstanding only. Does not include unlisted, private, or dual-class non-traded shares. Implied market cap may vary.

Shares Outstanding

443.30M

Volume

135

Avg. Volume

5.21M

Financials (TTM)

Gross Profit

$3.34B

Operating Income

-$639.80M

EBITDA

$1.34B

Operating Cash Flow

$1.82B

Capital Expenditure

-$34.20M

Free Cash Flow

$1.79B

Cash & ST Invst.

$806.90M

Total Debt

$10.54B

Invesco Performance Analysis

Invesco annual revenue and year-over-year revenue growth by fiscal year
Fiscal yearPeriod endRevenueYoY growth
20222022-12-31USD 5,922,000,000-15.5%
20232023-12-31USD 5,540,100,000-6.4%
20242024-12-31USD 6,009,100,0008.5%
20252025-12-31USD 6,445,000,0007.3%
Invesco sequential (quarter-over-quarter) revenue growth by fiscal quarter
Fiscal quarterPeriod endQoQ growth
Q22025-06-30-0.9%
Q32025-09-308.2%
Q42025-12-313.1%
Q12026-03-313.1%
Invesco annual diluted earnings per share and year-over-year EPS growth by fiscal year
Fiscal yearPeriod endDiluted EPSYoY growth
20222022-12-31USD 1.49-50.3%
20232023-12-31USD -0.73N/A
20242024-12-31USD 1.18N/A
20252025-12-31USD -1.60N/A
Invesco sequential (quarter-over-quarter) diluted earnings per share growth by fiscal quarter
Fiscal quarterPeriod endQoQ growth
Q22025-06-30-107.9%
Q32025-09-302300.0%
Q42025-12-31-495.5%
Q12026-03-31119.5%

Revenue Growth Rate

Annual and quarterly growth comparison

Earnings Per Share Growth Rate

Annual and quarterly EPS growth comparison

Quarterly Performance

Name
Q1 2026YOY CHG

Revenue

$1.74B

+14.1%

Gross Profit

$1.14B

+105.7%

Gross Margin

65.53%

N/A

Market Cap

$13.27BMarket cap calculated using publicly traded shares outstanding only. Does not include unlisted, private, or dual-class non-traded shares. Implied market cap may vary.

N/A

Market Cap/Employee

$1.77M

N/A

Employees

7,499

N/A

Net Income

$268.60M

+16.6%

EBITDA

$357.70M

-10.5%

Quarterly Fundamentals

Name
Q1 2026YOY CHG

Total Cash

$806.90M

-56.9%

Total Debt

$10.54B

+992.5%

Accounts Receivable

$8.96B

+692.1%

Inventory

$0.00

N/A

Long Term Debt

$10.54B

+992.5%

Short Term Debt

$0.00

N/A

Return on Assets

-0.91%

N/A

Return on Invested Capital

-2.53%

N/A

Free Cash Flow

$198.40M

+283.7%

Operating Cash Flow

$212.60M

+351.3%

Other Investments to Explore

People Also Watch

Symbol / CompanyPricePrice Chg
GLGlobe Life Inc.
$173.48+1.40%
AIZAssurant, Inc.
$276.94+1.15%
AFGAmerican Financial Group, Inc.
$143.76+1.84%
SEICSEI Investments Company
$99.22+2.57%

Trending Stocks

Symbol / CompanyPricePrice Chg
TSLLDirexion Shares ETF Trust - Direxion Daily Tsla Bull 2x Shares
$7.42-0.04%
NOKNokia
$9.10-0.06%
STAKStak
$9.27+6.02%
MUUDirexion Shares ETF Trust - Direxion Daily Mu Bull 2x Shares
$31.27-0.14%

Questions About IVZ

What is the current price of Invesco?

Invesco is trading at $29.93 per share.

What is the 52-week range for Invesco?

Over the past 52 weeks, Invesco has traded between $20.08 and $31.02.

How much debt does Invesco have?

As of the most recent reporting period, Invesco reported total debt of $1.97B.

How much cash does Invesco have on hand?

Invesco reported $1.71B in cash and cash equivalents in its most recent financial results.

What is Invesco’s dividend yield?

Invesco currently has a dividend yield of 2.82%.

Premium Investing Services

Invest better with The Motley Fool. Get stock recommendations, portfolio guidance, and more from The Motley Fool's premium services.