Accessibility Menu
Simpson Manufacturing logo

Simpson Manufacturing(NYSE) SSD

Market Cap$7.72BMarket cap calculated using publicly traded shares outstanding only. Does not include unlisted, private, or dual-class non-traded shares. Implied market cap may vary.
Since IPO (1994)+8,127%
5 Year+74%
1 Year+5%
1 Month-8%
$187.69
+0.55%
+1.02Today
After hours$187.75+$0.06 (+0.03%)
Simpson Manufacturing last closing stock price
MetricPriceDate
Last closeUSD 187.742026-07-31
Simpson Manufacturing stock price return by period
PeriodPrice returnPrice at period startPeriod start date
1 week-3.17%USD 193.882026-07-24
1 month-7.57%USD 203.122026-07-01
3 month-2.1%USD 191.772026-05-01
Year to date+16.85%USD 160.672025-12-31
1 year+5.34%USD 178.232025-07-31
3 year+21.19%USD 154.922023-08-01
5 year+73.56%USD 108.172021-07-30
Since inception+8,126.83%USD 2.281994-05-26

Simpson Manufacturing Financials at a Glance

Market Cap

$7.72BMarket cap calculated using publicly traded shares outstanding only. Does not include unlisted, private, or dual-class non-traded shares. Implied market cap may vary.

Revenue (TTM)

$2.42B

Net Income (TTM)

$378.92M

EPS (TTM)

$9.15

P/E Ratio

20.51

Dividend

$1.17

Beta (Volatility)

1.01 (Average)

Price

$187.69

Volume

374,760.981

Open

$186.97

Previous Close

$187.74

Daily Range

$184.03 - $188.48

52-Week Range

$156.32 - $213.49

Estimated Earnings Date

Oct 26, 2026

SSD: Motley Fool Moneyball Superscore

76

Our CEO Is Handing Members His Secret Weapon

It's called Motley Fool Moneyball, our new proprietary AI tool

We spent over half a million dollars in R&D to build a tool that makes stock research faster, sharper, and smarter. Our analysts use it every day, and now, you can too.

Get Access Now

About Simpson Manufacturing

Simpson makes metal parts that hold buildings together during storms or earthquakes. These products help contractors build stronger homes and commercial structures. The company also provides software that helps builders plan their projects accurately.

The Building Blocks

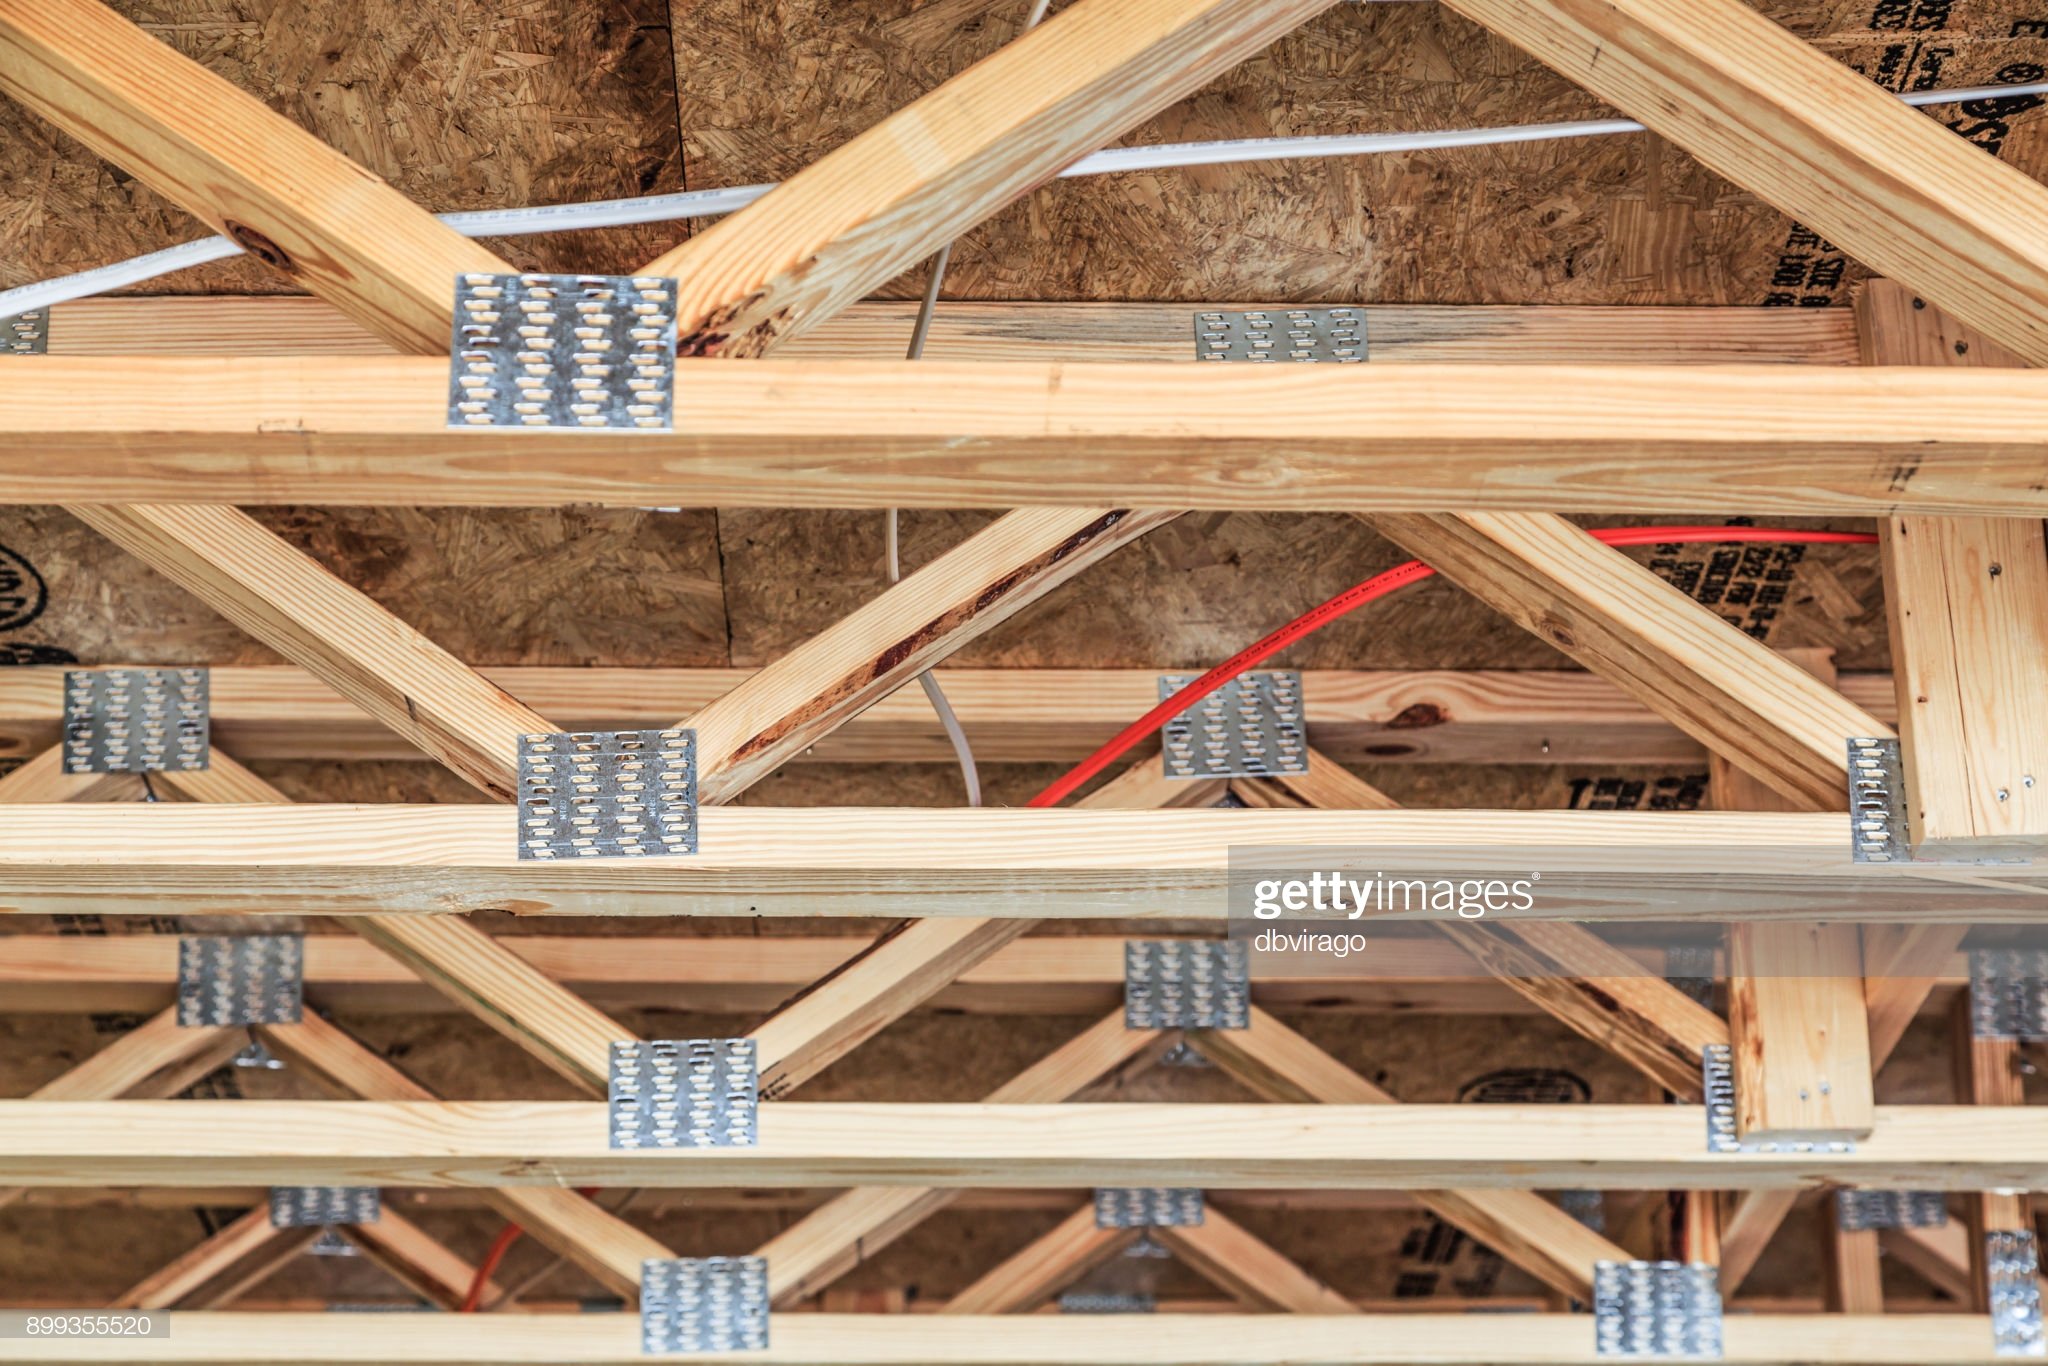
  • Wood Construction Products: Connectors, truss plates, and fastening systems used in light-frame buildings; accounted for 77.8% of net sales in 2025.
  • Concrete Construction Products: Adhesives, mechanical anchors, and repair chemicals for masonry and steel applications.
  • Software and Services: Digital tools and engineering support that help professionals select and specify the right building materials.

Growth and Expansion

  • Developed over 50 new products in 2025 including connectors for mass timber and offsite construction.
  • Expanded the Simpson Strong-Tie brand presence in the European residential and commercial markets.
  • Introduced 3D visualization and artificial intelligence tools to help lumber dealers and homeowners design structures.

What Makes Simpson Different

The company tests its products in eight state-of-the-art labs to ensure they meet strict building codes. Its distribution network is designed to fill most customer orders within 24 to 48 hours.

The Scorecard

  • Revenue reached $539.3 million in Q4 2025, up 4.2% from Q4 2024.
  • Operating cash flow rose to $153.7 million in Q4 2025, a 32.7% increase year-over-year.
  • Free cash flow hit $117 million in Q4 2025, up 94.1% from the previous year.
  • Net income was $56.2 million in Q4 2025, up 1.4% from $55.5 million in Q4 2024.

Bottom Line

Simpson has transitioned from a traditional hardware manufacturer into a technology-driven provider of structural solutions. By diversifying into software and international markets, the company has reduced its total reliance on U.S. housing starts.

AI Generated • Apr 22, 2026

Industry

Building Products

Employees

5,545

CEO

Michael Olosky, MBA

Headquarters

Pleasanton, CA 94588, US

SSD Financials

Key Financial Metrics (TTM)

Gross Margin

45.77%

Operating Margin

20.55%

Net Income Margin

15.65%

Return on Equity

18.44%

Return on Capital

17.58%

Return on Assets

12.07%

Earnings Yield

4.88%

Dividend Yield

0.62%

Payout Ratio

9.52%

Stock Overview

Market Cap

$7.72BMarket cap calculated using publicly traded shares outstanding only. Does not include unlisted, private, or dual-class non-traded shares. Implied market cap may vary.

Shares Outstanding

41.14M

Volume

374.76K

Avg. Volume

324.43K

Financials (TTM)

Gross Profit

$1.11B

Operating Income

$497.72M

EBITDA

$602.87M

Operating Cash Flow

$323.89M

Capital Expenditure

-$72.98M

Free Cash Flow

$250.92M

Cash & ST Invst.

$450.53M

Total Debt

$423.76M

Simpson Manufacturing Performance Analysis

Simpson Manufacturing annual revenue and year-over-year revenue growth by fiscal year
Fiscal yearPeriod endRevenueYoY growth
20222022-12-31USD 2,116,087,00034.5%
20232023-12-31USD 2,213,803,0004.6%
20242024-12-31USD 2,232,139,0000.8%
20252025-12-31USD 2,332,808,0004.5%
Simpson Manufacturing sequential (quarter-over-quarter) revenue growth by fiscal quarter
Fiscal quarterPeriod endQoQ growth
Q32025-09-30-1.2%
Q42025-12-31-13.5%
Q12026-03-319.0%
Q22026-06-3014.1%
Simpson Manufacturing annual diluted earnings per share and year-over-year EPS growth by fiscal year
Fiscal yearPeriod endDiluted EPSYoY growth
20222022-12-31USD 7.7626.8%
20232023-12-31USD 8.266.5%
20242024-12-31USD 7.60-8.0%
20252025-12-31USD 8.248.4%
Simpson Manufacturing sequential (quarter-over-quarter) diluted earnings per share growth by fiscal quarter
Fiscal quarterPeriod endQoQ growth
Q32025-09-304.0%
Q42025-12-31-47.7%
Q12026-03-3157.8%
Q22026-06-3045.1%

Revenue Growth Rate

Annual and quarterly growth comparison

Earnings Per Share Growth Rate

Annual and quarterly EPS growth comparison

Quarterly Performance

Name
Q2 2026YOY CHG

Revenue

$671.08M

+6.3%

Gross Profit

$318.19M

+8.1%

Gross Margin

47.42%

N/A

Market Cap

$7.72BMarket cap calculated using publicly traded shares outstanding only. Does not include unlisted, private, or dual-class non-traded shares. Implied market cap may vary.

N/A

Market Cap/Employee

$1.39M

N/A

Employees

5,545

N/A

Net Income

$127.04M

+22.7%

EBITDA

$194.57M

+21.3%

Quarterly Fundamentals

Name
Q2 2026YOY CHG

Total Cash

$450.53M

+136.6%

Total Debt

$423.76M

-7.4%

Accounts Receivable

$438.05M

+5.3%

Inventory

$513.52M

-12.5%

Long Term Debt

$408.76M

-6.0%

Short Term Debt

$15.00M

-33.3%

Return on Assets

12.07%

N/A

Return on Invested Capital

18.48%

N/A

Free Cash Flow

-$17.92M

-120.5%

Operating Cash Flow

-$35.55M

-128.4%

Other Investments to Explore

People Also Watch

Symbol / CompanyPricePrice Chg
FSSFederal Signal Corporation
$124.95+0.32%
AWIArmstrong World Industries, Inc.
$174.66+0.17%
AAONAAON, Inc.
$89.06+1.68%
ALAir Lease Corporation
$65.00+0.00%

Trending Stocks

Symbol / CompanyPricePrice Chg
NVDANvidia
$200.75+0.03%
AAPLApple
$308.91-0.07%
AMZNAmazon
$271.58+0.15%
INTCIntel
$90.20-0.01%

Questions About SSD

What is the current price of Simpson Manufacturing?

Simpson Manufacturing is trading at $187.74 per share.

What is the 52-week range for Simpson Manufacturing?

Over the past 52 weeks, Simpson Manufacturing has traded between $156.32 and $213.49.

How much debt does Simpson Manufacturing have?

As of the most recent reporting period, Simpson Manufacturing reported total debt of $423.76M.

How much cash does Simpson Manufacturing have on hand?

Simpson Manufacturing reported $450.53M in cash and cash equivalents in its most recent financial results.

What is Simpson Manufacturing’s dividend yield?

Simpson Manufacturing currently has a dividend yield of 0.62%.

Premium Investing Services

Invest better with The Motley Fool. Get stock recommendations, portfolio guidance, and more from The Motley Fool's premium services.