Accessibility Menu
Texas Pacific Land logo

Texas Pacific Land(NYSE) TPL

Current Price$402.08
Market Cap$28.93BMarket cap calculated using publicly traded shares outstanding only. Does not include unlisted, private, or dual-class non-traded shares. Implied market cap may vary.
Since IPO (1968)+1,170,223%
5 Year+167%
1 Year+31%
1 Month+11%
Texas Pacific Land last closing stock price
MetricPriceDate
Last closeUSD 419.442026-07-24
Texas Pacific Land stock price return by period
PeriodPrice returnPrice at period startPeriod start date
1 week+0.9%USD 415.702026-07-17
1 month+11.09%USD 377.562026-06-24
3 month-4.29%USD 438.242026-04-24
Year to date+46.43%USD 286.452025-12-31
1 year+30.61%USD 321.142025-07-24
3 year+157.95%USD 162.602023-07-25
5 year+167.24%USD 156.952021-07-23
Since inception+1,170,222.96%USD 0.041968-01-02

Texas Pacific Land Financials at a Glance

Market Cap

$28.93BMarket cap calculated using publicly traded shares outstanding only. Does not include unlisted, private, or dual-class non-traded shares. Implied market cap may vary.

Revenue (TTM)

$839.03M

Net Income (TTM)

$503.63M

EPS (TTM)

$7.30

P/E Ratio

57.49

Dividend

$4.40

Beta (Volatility)

0.98 (Low)

Price

$402.08

Volume

4,645

Open

$415.85

Previous Close

$419.44

Daily Range

$400.73 - $421.94

52-Week Range

$269.23 - $547.20

Estimated Earnings Date

Aug 5, 2026

TPL: Motley Fool Moneyball Superscore

79

Our CEO Is Handing Members His Secret Weapon

It's called Motley Fool Moneyball, our new proprietary AI tool

We spent over half a million dollars in R&D to build a tool that makes stock research faster, sharper, and smarter. Our analysts use it every day, and now, you can too.

Get Access Now

About Texas Pacific Land

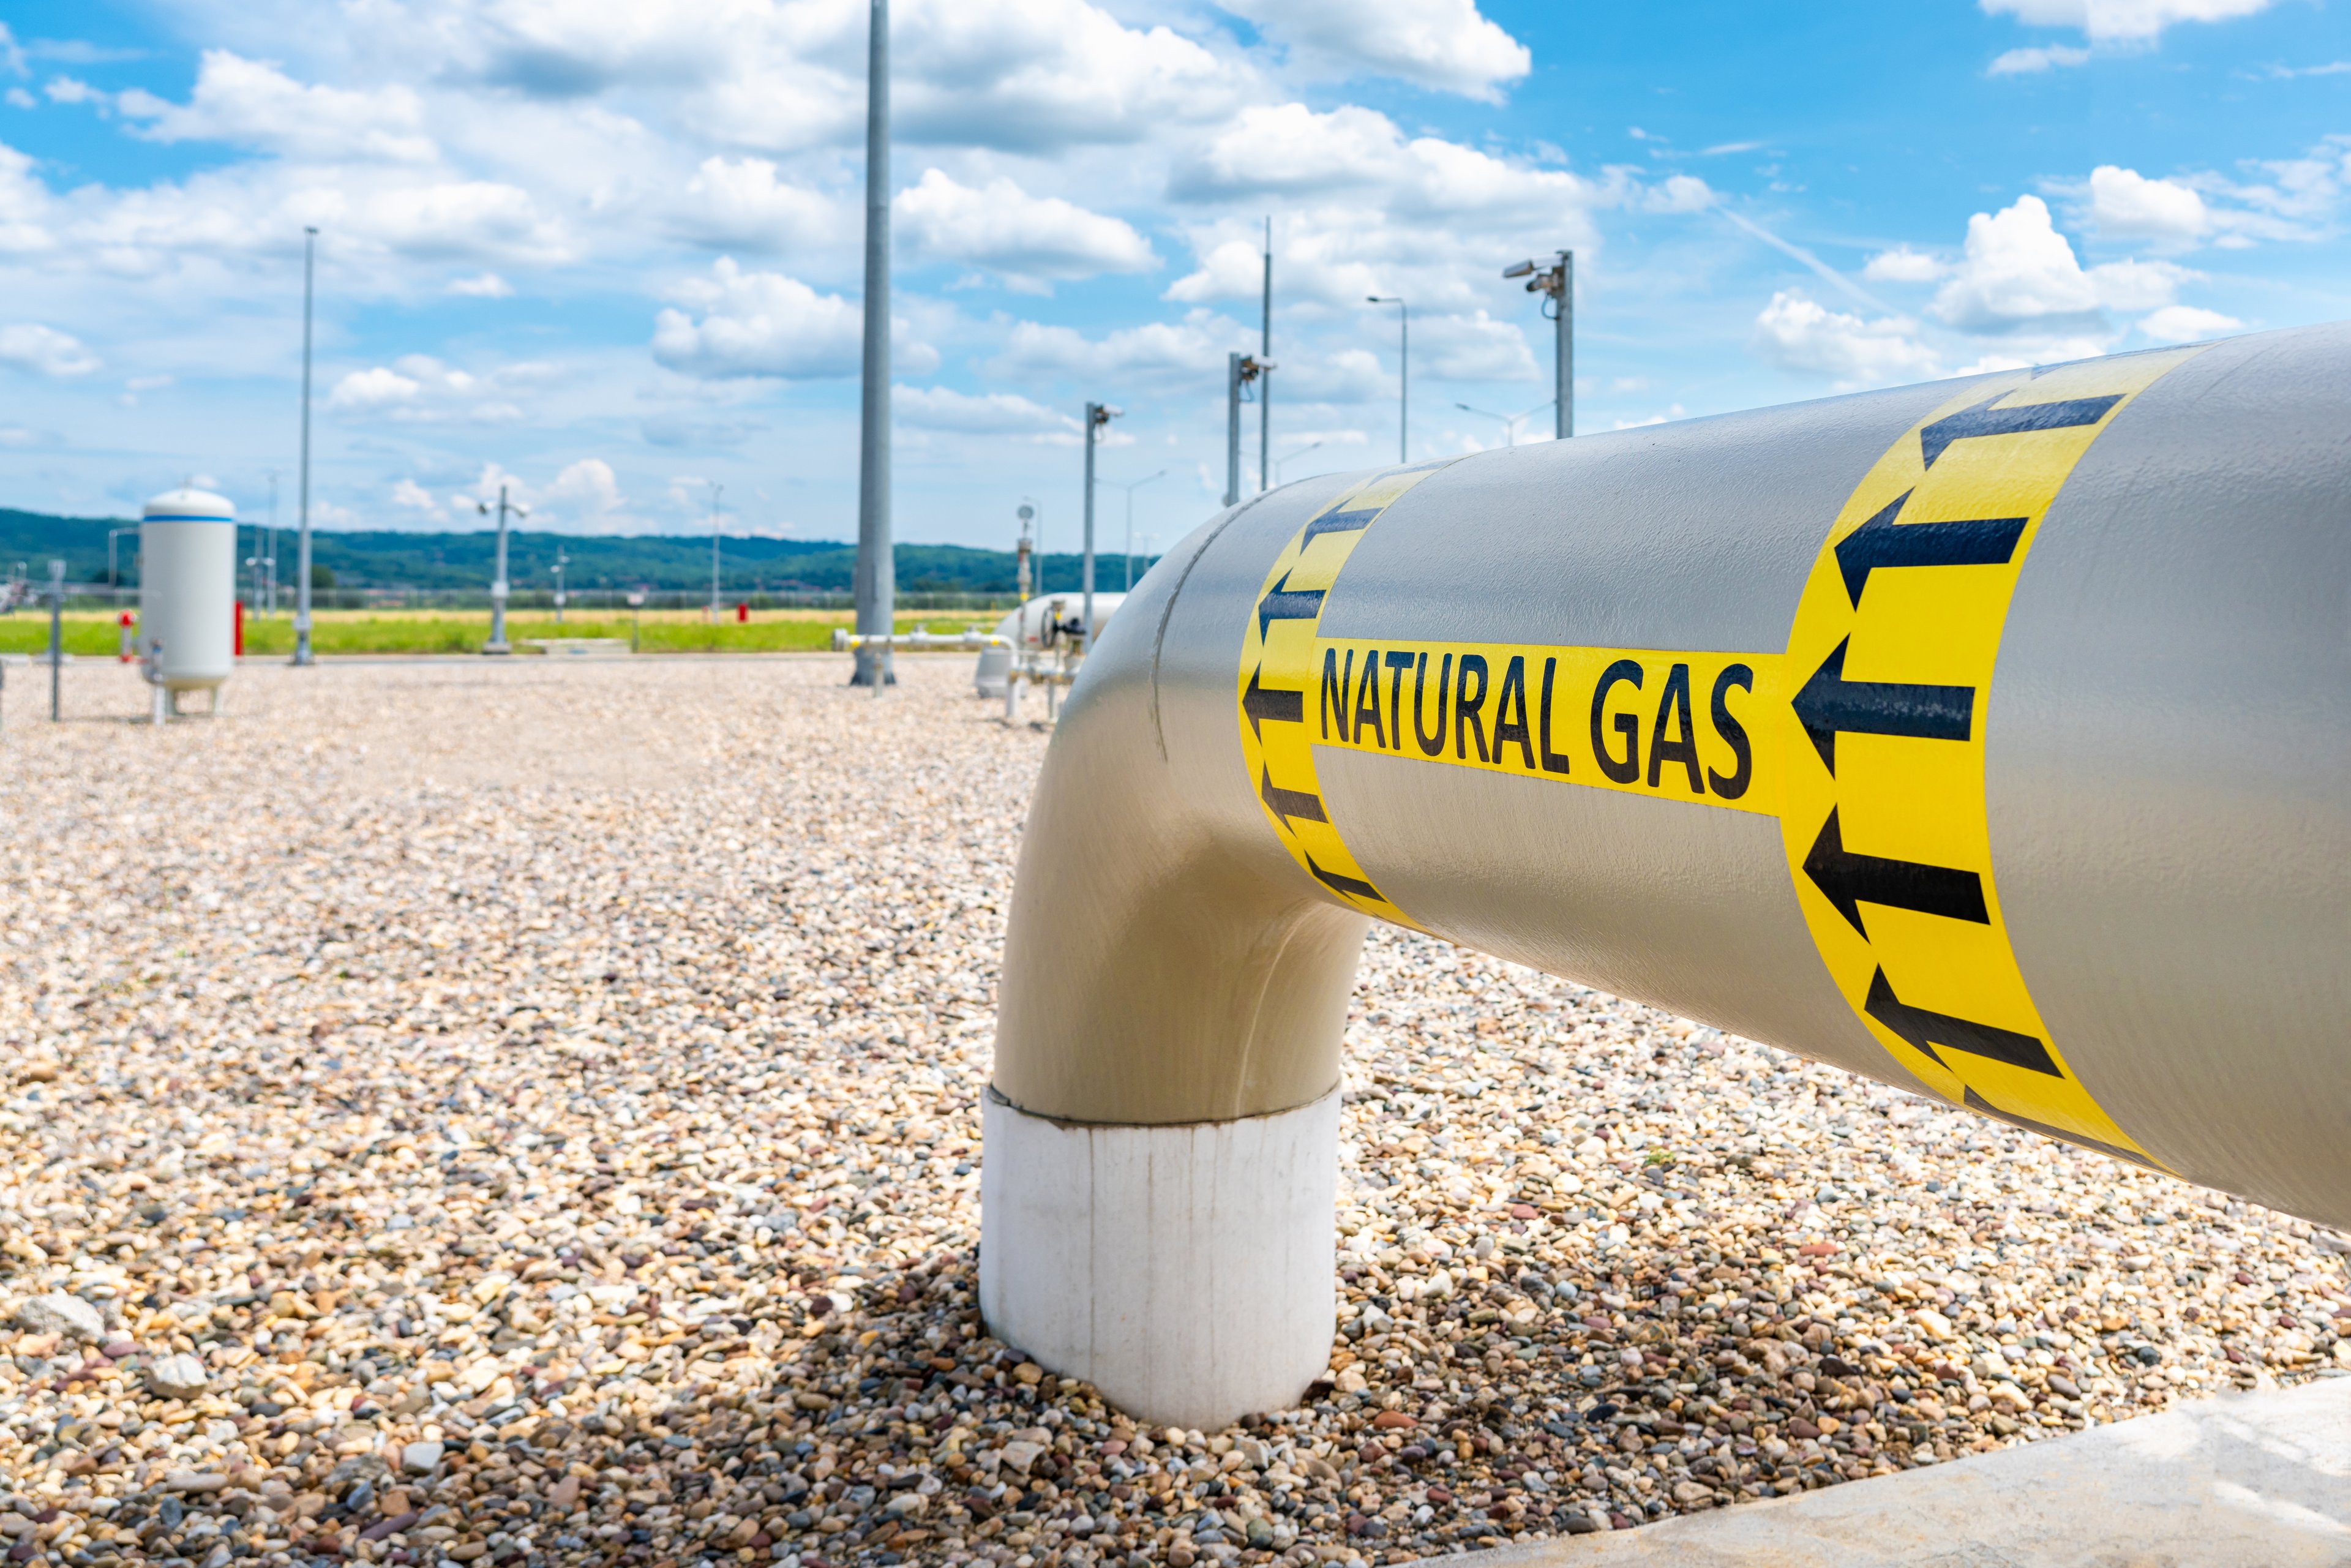
Texas Pacific makes money when others pump oil on its land. It lets energy companies use its ground and water to run their businesses. The firm also sells materials like dirt and rocks used to build oilfield roads.

What Texas Pacific Does

  • Land and Resource Management: Manages 882,000 acres and earns royalties from oil and gas produced by other companies; accounted for 62% of revenue in 2025.
  • Water Services and Operations: Provides water for drilling and treats used water for oil companies; generated 38% of revenue in 2025.
  • Surface Access: Charges fees for pipelines, power lines, and roads built across its land.
  • Material Sales: Sells caliche, a local rock used to build flat surfaces for heavy drilling equipment.

Growth and Expansion

  • Acquired 17,306 net royalty acres in the Midland Basin for $450.7 million in November 2025.
  • Invested $50 million in Bolt Data & Energy in December 2025 to develop data centers on company land.
  • Purchased 8,147 acres of land in Martin County for $31.4 million in September 2025.
  • Expanded into water recycling technology through its subsidiary Transmissive Water Services, spending $33.6 million in 2025.

What Makes the Business Different

Texas Pacific owns a massive amount of land without the high costs of actually drilling for oil. Its unique position in the Permian Basin allows it to earn money from the same acre through land fees, water sales, and oil royalties.

The Scorecard

  • Revenue reached $211.6 million in Q4 2025, up 13.9% from Q4 2024.
  • Net income grew to $123.3 million in Q4 2025, a 4.2% increase year-over-year.
  • Operating income rose to $149.2 million in Q4 2025, up 4.7% from the previous year.
  • Free cash flow was $85 million in Q4 2025, down 25% from Q4 2024.
  • The company completed a three-for-one stock split in December 2025 to change its share count.

Bottom Line

Texas Pacific has moved beyond simple land ownership to become a full-service partner for energy and data companies. Its shift into water technology and data centers shows an evolution toward more diverse income streams from its Texas acreage.

AI Generated • Apr 18, 2026

Industry

Oil, Gas and Consumable Fuels

Sector

Energy

Employees

114

CEO

Tyler Glover

Headquarters

Dallas, TX 75204, US

TPL Financials

Key Financial Metrics (TTM)

Gross Margin

97.70%

Operating Margin

74.42%

Net Income Margin

60.03%

Return on Equity

35.52%

Return on Capital

39.71%

Return on Assets

28.75%

Earnings Yield

1.74%

Dividend Yield

0.54%

Payout Ratio

30.21%

Stock Overview

Market Cap

$28.93BMarket cap calculated using publicly traded shares outstanding only. Does not include unlisted, private, or dual-class non-traded shares. Implied market cap may vary.

Shares Outstanding

68.97M

Volume

4.64K

Avg. Volume

402.01K

Financials (TTM)

Gross Profit

$819.72M

Operating Income

$624.42M

EBITDA

$697.28M

Operating Cash Flow

$551.19M

Capital Expenditure

-$57.91M

Free Cash Flow

$493.28M

Cash & ST Invst.

$247.57M

Total Debt

$15.84M

Texas Pacific Land Performance Analysis

Texas Pacific Land annual revenue and year-over-year revenue growth by fiscal year
Fiscal yearPeriod endRevenueYoY growth
20222022-12-31USD 667,422,00048.0%
20232023-12-31USD 631,595,000-5.4%
20242024-12-31USD 705,823,00011.8%
20252025-12-31USD 798,190,00013.1%
Texas Pacific Land sequential (quarter-over-quarter) revenue growth by fiscal quarter
Fiscal quarterPeriod endQoQ growth
Q22025-06-30-4.3%
Q32025-09-308.3%
Q42025-12-314.2%
Q12026-03-3111.9%
Texas Pacific Land annual diluted earnings per share and year-over-year EPS growth by fiscal year
Fiscal yearPeriod endDiluted EPSYoY growth
20222022-12-31USD 6.4265.9%
20232023-12-31USD 5.86-8.6%
20242024-12-31USD 6.5712.1%
20252025-12-31USD 6.976.1%
Texas Pacific Land sequential (quarter-over-quarter) diluted earnings per share growth by fiscal quarter
Fiscal quarterPeriod endQoQ growth
Q22025-06-30-3.6%
Q32025-09-304.6%
Q42025-12-311.1%
Q12026-03-3116.3%

Revenue Growth Rate

Annual and quarterly growth comparison

Earnings Per Share Growth Rate

Annual and quarterly EPS growth comparison

Quarterly Performance

Name
Q1 2026YOY CHG

Revenue

$236.82M

+20.8%

Gross Profit

$194.45M

+12.5%

Gross Margin

82.11%

N/A

Market Cap

$28.93BMarket cap calculated using publicly traded shares outstanding only. Does not include unlisted, private, or dual-class non-traded shares. Implied market cap may vary.

N/A

Market Cap/Employee

$253.78M

N/A

Employees

114

N/A

Net Income

$142.90M

+18.4%

EBITDA

$198.60M

+19.4%

Quarterly Fundamentals

Name
Q1 2026YOY CHG

Total Cash

$247.57M

-46.2%

Total Debt

$15.84M

N/A

Accounts Receivable

$181.05M

+31.0%

Inventory

$0.00

N/A

Long Term Debt

$15.84M

N/A

Short Term Debt

$0.00

N/A

Return on Assets

28.75%

N/A

Return on Invested Capital

37.88%

N/A

Free Cash Flow

$154.66M

+4.7%

Operating Cash Flow

$162.01M

+3.4%

Other Investments to Explore

People Also Watch

Symbol / CompanyPricePrice Chg
PBAPembina Pipeline Corporation
$50.13-2.41%
FTITechnipFMC plc
$75.29-1.90%
TSTenaris S.A.
$56.45-2.12%
HALHalliburton Company
$32.50-2.59%

Trending Stocks

Symbol / CompanyPricePrice Chg
NVDGraniteShares ETF Trust - GraniteShares 2x ShortDA Daily ETF
$5.24+0.10%
TSLLDirexion Shares ETF Trust - Direxion Daily Tsla Bull 2x Shares
$7.20-0.03%
AALAmerican Airlines Group
$14.59+0.01%
FFord Motor Company
$14.46+0.01%

Questions About TPL

What is the current price of Texas Pacific Land?

Texas Pacific Land is trading at $402.08 per share.

What is the 52-week range for Texas Pacific Land?

Over the past 52 weeks, Texas Pacific Land has traded between $269.23 and $547.20.

How much debt does Texas Pacific Land have?

As of the most recent reporting period, Texas Pacific Land reported total debt of $15.84M.

How much cash does Texas Pacific Land have on hand?

Texas Pacific Land reported $249.21M in cash and cash equivalents in its most recent financial results.

What is Texas Pacific Land’s dividend yield?

Texas Pacific Land currently has a dividend yield of 0.54%.

Premium Investing Services

Invest better with The Motley Fool. Get stock recommendations, portfolio guidance, and more from The Motley Fool's premium services.