These retail rivals have similar margins, but different revenue and growth profiles. Walmart (WMT 0.93%) enjoys far greater scale and revenue, and its stock has significantly outperformed Costco Wholesale’s (COST 0.63%) over the last two years. This is despite Costco posting a 9.2% year-over-year increase in sales last quarter, higher than Walmart’s 5.6%.
But recent growth doesn’t tell the whole story. Both companies are investing in technology that could be a deciding factor in how these stocks perform over the next five years and beyond.
Walmart: Maintaining High Revenue Volumes
Walmart primarily generates revenue through its massive global network of retail supercenters, warehouse clubs, and diverse e-commerce websites.
It recently announced a massive reinvestment plan to remodel hundreds of stores across multiple states. In the quarter that ended Jan. 31, 2026, it reported a net income margin of 2.3%.

NASDAQ: WMT
Key Data Points
Costco Wholesale: Generating Steady Sales
Costco Wholesale primarily earns revenue by operating a wide network of membership warehouses that offer bulk branded and private-label merchandise to consumers.
While navigating several recent product recalls and ongoing class-action litigation, it implemented a nationwide rollout of membership-card scanners. For the quarter that ended Feb. 15, 2026, it reported a net income margin of 2.9%.

NASDAQ: COST
Key Data Points
Why Revenue Matters for Retail Investors
Revenue is the most fundamental measure of a company’s performance. Changes over time can tell investors how well the company is executing its growth strategy, including its efforts to reach new customers. It becomes a very useful measure for comparing companies in the same industry, like Walmart and Costco.
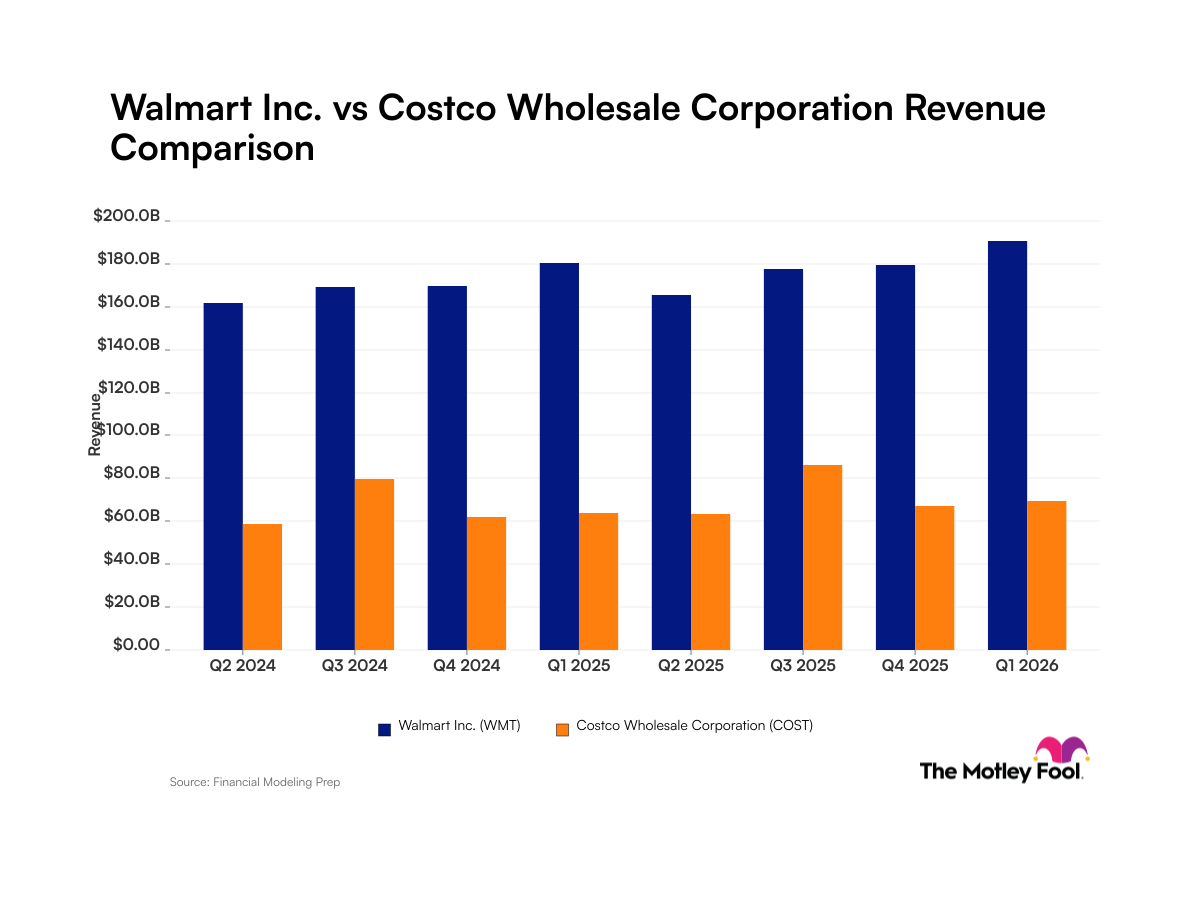
Image source: The Motley Fool.
Quarterly Revenue for Walmart and Costco Wholesale
| Quarter (Period End) | Walmart Revenue | Costco Wholesale Revenue |
|---|---|---|
| Q2 2024 | $161.5 billion (period ended April 2024) | $58.5 billion (period ended May 2024) |
| Q3 2024 | $169.3 billion (period ended July 2024) | $79.7 billion (period ended Sept. 2024) |
| Q4 2024 | $169.6 billion (period ended Oct. 2024) | $62.2 billion (period ended Nov. 2024) |
| Q1 2025 | $180.6 billion (period ended Jan. 2025) | $63.7 billion (period ended Feb. 2025) |
| Q2 2025 | $165.6 billion (period ended April 2025) | $63.2 billion (period ended May 2025) |
| Q3 2025 | $177.4 billion (period ended July 2025) | $86.2 billion (period ended Aug. 2025) |
| Q4 2025 | $179.5 billion (period ended Oct. 2025) | $67.3 billion (period ended Nov. 2025) |
| Q1 2026 | $190.7 billion (period ended Jan. 2026) | $69.6 billion (period ended Feb. 2026) |
Data source: Company filings. Data as of May 10, 2026.
Foolish Take
The revenue performance between these two competitors paints a clear contrast. While Walmart’s quarterly revenue is massive compared to Costco’s, Costco has consistently reported higher year-over-year growth.
But Costco’s superior quarterly growth hasn’t translated to better returns to shareholders. Walmart stock has outperformed Costco over the past two years, rising 115%, compared with Costco’s 30% return.
Looking forward, the better stock may be the one that can better leverage artificial intelligence (AI) and e-commerce investments to drive greater revenue growth and earnings.
Walmart has its AI shopping assistant, Sparky, that is already driving higher order values. Meanwhile, Costco is touting its digital investments, including AI, for driving meaningful improvements in checkout speed and employee productivity in the latest quarter.
The better stock over the next five years will likely center on each company’s ability to leverage technology to improve the customer experience and reduce operational costs. Watch to see if Costco can use its digital initiatives to not only close the revenue gap with Walmart, but potentially better earnings growth.