The iShares Core High Dividend ETF (HDV 0.34%) and the Schwab U.S. Dividend Equity ETF (SCHD 0.52%) both target U.S. companies with strong dividend profiles, but their strategies and results diverge in key areas. The two ETFs differ most in recent returns, dividend yield, and portfolio construction, despite similar sector tilts and low costs.
We compare the two dividend ETFs based on cost, yield, performance, risk, and portfolio composition below to help investors decide which fund may appeal to them, depending on their income needs and risk preferences.
Snapshot (cost & size)
| Metric | HDV | SCHD |
|---|---|---|
| Issuer | IShares | Schwab |
| Expense ratio | 0.08% | 0.06% |
| 1-yr return (as of Dec. 30, 2025) | 9.5% | 1.5% |
| Dividend yield | 3.2% | 3.8% |
| Beta | 0.48 | 1 |
| AUM | $12 billion | $72 billion |
Beta measures price volatility relative to the S&P 500; beta is calculated from five-year weekly returns. The 1-yr return represents total return over the trailing 12 months.
SCHD is marginally more affordable than HDV with a 0.06% expense ratio and also offers a higher dividend payout, with a yield of 3.8% compared to HDV’s 3.2%.
Performance & risk comparison
| Metric | HDV | SCHD |
|---|---|---|
| Max drawdown (5 y) | -15.41% | -16.86% |
| Growth of $1,000 over 5 years | $1,400 | $1,300 |
What's inside the ETF portfolios
The Schwab U.S. Dividend Equity ETF holds 103 U.S. stocks with a focus on sustainable dividends. Its portfolio mix is heavily weighted towards energy (19.34%), consumer defensive (18.5%), healthcare (16.1%), and industrials (12.28%) sectors. The ETF's largest positions as of Dec. 30 are Bristol Myers Squibb (BMY 1.37%), Merck (MRK +0.07%), Lockheed Martin (LMT 0.88%), and ConocoPhillips (COP 2.23%), none of which appear among HDV’s top holdings. The fund has a 14.2-year track record and has grown to over $72 billion in assets under management (AUM), making it one of the largest U.S. equity income ETFs.
The iShares Core High Dividend ETF, meanwhile, has a slightly more concentrated portfolio of 74 stocks, with notable sector tilts toward consumer defensive, energy, and healthcare. Its top positions as of Dec. 30 were Exxon Mobil (XOM +0.62%), Johnson & Johnson (JNJ 0.43%), Chevron (CVX +0.23%), and Abbvie (ABBV 0.48%), giving it a heavier energy and healthcare bias at the top. Both funds avoid leverage, hedging, or ESG overlays, keeping their strategies straightforward and focused on dividend strength.
For more guidance on ETF investing, check out the full guide at this link.
What this means for investors
If you look at the size of the portfolio, cost, and dividend yields of the iShares Core High Dividend ETF and the Schwab U.S. Dividend Equity ETFs, you'd expect SCHD to outperform. You'd be surprised to know that HDV has been a steady outperformer over the past one, three, and five years, beating SCHD by a wide margin.
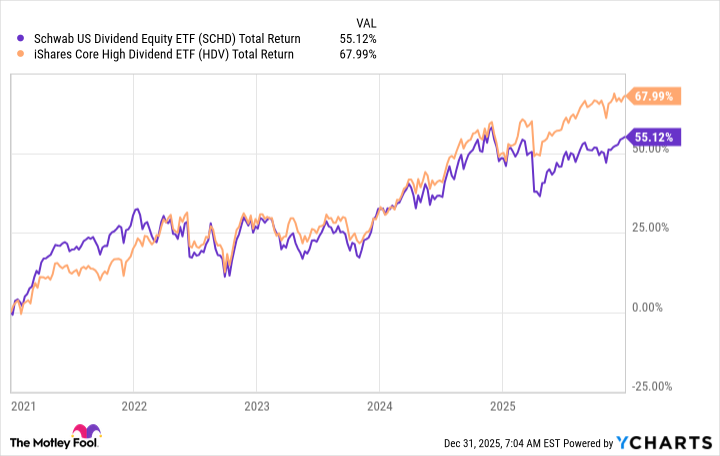
SCHD Total Return Level data by YCharts
Both ETFs focus on sustainable and quality dividends. HDV, for instance, tracks the Morningstar Dividend Yield Focus Index, which focuses on stocks with high yields backed by financial fortitude. SCHD, which tracks the Dow Jones U.S. Dividend 100 Index, also focuses on high-yield stocks that have a strong record of dividend payments and backed by strong financials.
Financial strength is crucial as companies can pay big and steady dividends and sustain high yields only if they are growing their cash flows steadily and have a strong balance sheet. Dividend stability and growth, and not yields, often contribute the most to a dividend stock's total returns in the long term.
From that standpoint, both SCHD and HDV are top-quality high-yield dividend ETFs for income investors. SCHD's high exposure to financials sector, however, has likely been a chink in its armor as persistently high interest rates have been a notable headwind for the sector in recent years. Comparatively, HDV's higher tilt towards energy has worked in investors' favor, as some of the largest energy stocks are also top-notch dividend-paying companies that have been able to generate solid cash flows despite volatile oil and gas prices.
The portfolio composition is perhaps one of the most important factors to consider when selecting between the two ETFs. Otherwise, a mix of both could be a smart addition to your portfolio to earn regular dividend income in 2026 and beyond.
Glossary
ETF (Exchange-Traded Fund): An investment fund traded on stock exchanges, holding a basket of assets like stocks or bonds.
Dividend yield: Annual dividends paid by a fund or stock divided by its current price, expressed as a percentage.
Expense ratio: The annual fee, as a percentage of assets, that a fund charges to cover operating costs.
Beta: A measure of a fund's volatility compared to the overall market, typically the S&P 500.
AUM (Assets Under Management): The total market value of assets that a fund manages on behalf of investors.
Max drawdown: The largest percentage drop from a fund's peak value to its lowest point over a specific period.
Portfolio concentration: The degree to which a fund's assets are invested in a small number of holdings or sectors.
Sector tilt: When a fund allocates more assets to certain industry sectors compared to others or to a benchmark.
Total return: The overall return from an investment, including price changes and all dividends or distributions.
Leverage: Borrowing money or using financial instruments to increase the potential return (and risk) of an investment.
Hedging: Strategies used to reduce or manage investment risk, often through derivatives or offsetting positions.
ESG overlay: Incorporating environmental, social, and governance criteria into investment selection or portfolio management.