Image source: P&G.
Procter & Gamble (PG +4.09%) is on track to close out another year of weak stock price gains. With just a few trading days to go in 2016, its 7% increase amounts to about half of the Dow's advance.
Despite huge direct cash returns to shareholders, the consumer goods titan hasn't been able to reward its owners with solid growth lately.
Instead, it lost market share in a stubbornly slow-growth industry environment.
Disappointing stock performance

This hasn't been just a recent struggle, as P&G undershot its core sales and profit growth targets in each of the last two fiscal years. As a result, the stock has underperformed the broader Dow over the last 5-year and 10-year time frames. Add dividends into the mix, and the gap closes, but P&G still trails its index.
Revenue slump
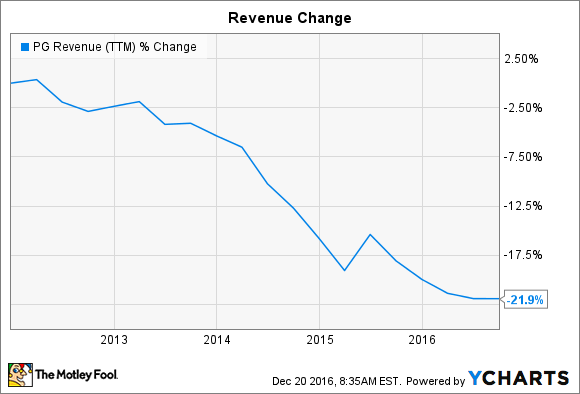
PG Revenue (TTM) data by YCharts.
Revenue is down by over 20% since 2011. Some of that decline can be tied to currency devaluations, which aren't within the company's control. Another part of the slump came from strategic moves aimed at slimming down the product portfolio to a more manageable, more profitable size.
However, P&G has also lost market share in each of the last two fiscal years, with organic growth slowing to a 1% pace last year. Rivals Kimberly-Clark (KMB +6.28%) and Unilever (UL +3.03%), meanwhile, have been consistently growing at between 3% and 5% each year, and both project similar gains ahead in 2017.
Missing profit goals

Image source: P&G investor presentation.
The many pressures on its business resulted in a slight decline in core earnings in each of the last two years. P&G's stated target is for profits to rise in the high single-digit range each year, and yet they fell by 2% in fiscal 2015 and fiscal 2016. Executives are optimistic that the current year will finally bring a return to form, with core earnings projected to rise about 6%.
Falling costs

PG Cost of Goods Sold (TTM) data by YCharts.
P&G has sliced billions of dollars out of its cost infrastructure through initiatives like reducing its workforce, using more automation in its production process, and dramatically simplifying its supply chain. Savings have yielded over $8 billion since the efficiency projects began about five years ago, and P&G plans to remove an additional $10 billion from its expenses over the next five fiscal years.
Weak dividend growth

Data source: Company financial filings.
Cost cuts have bought P&G precious space to continue investing in the business during a multiyear slowdown in the industry. Its dividend growth pace took a major step down, though. This year's 1% uptick was the weakest in modern time for P&G shareholders. While the boost kept the company's impressive 60-year growth streak alive, a payout ratio that crested 100% of earnings forced management to take a conservative approach to dividend growth.
Slumping share count

PG Average Diluted Shares Outstanding (Annual) data by YCharts.
Procter & Gamble is spending aggressively to retire its stock. It directed an average of $12 billion per year toward cash returns since fiscal 2011, most of which was aimed at share buybacks. That annual figure is rising to $14 billion over the coming years thanks to the almost $10 billion of cash that P&G raised through selling off many of its brands. As a result, P&G's share count is trending lower, which has helped protect investors from a more dramatic drop in per-share profits.
Solid cash returns to shareholders are likely to continue thanks to the company's world-class operating strength. However, market-beating capital gains aren't likely until P&G can find a way to return to an organic sales growth pace that at least modestly outperforms the markets in which it competes.