eBay (EBAY +2.75%) shareholders are having a good year so far. The e-commerce giant's stock has outpaced the broader market as Wall Street gains confidence that its business is on the upswing. Following several quarters of investments in improving the shopping experience, for example, last quarter eBay posted some of its strongest revenue metrics in over two years.
Below, we'll look at a few of the key trends that describe this business.

Image source: Getty Images.
Active buyers

Active buyers over the past 12-month period. Image source: eBay investor presentation.
eBay makes money by facilitating transactions between buyers and sellers. And because sellers will normally pick up and migrate to the selling platform where they can best move their products, the pool of buyers is a core metric by which investors can judge the overall strength of this business.
Last quarter eBay added 2 million buyers to push its base to 169 million. That marked a full-percentage-point increase over the growth pace in the prior two quarters. In a conference call with investors, management said several positive trends combined to generate that happy result, including increased buying activity and improved new-buyer acquisition in the key U.S. market.
Merchandise volume

Gross merchandise volume by quarter, split between U.S. and international segments. Image source: eBay investor presentation.
Revenue is mainly a function of the total value of merchandise that trades hands through eBay's platform. Gross merchandise volume, or GMV, has been rising at a steady 5% pace -- after accounting for currency fluctuations -- for over a year. The core marketplace segment rose at a 4% clip, but overall revenue growth was pulled higher thanks to contributions from the ticket specialist StubHub and eBay's classified ad platform.
Operating margin

EBAY Operating Margin (TTM) data by YCharts.
At 26% of revenue, eBay's single biggest operating expense is sales and marketing, which consists of all the company's online and offline efforts to stand out against a crowd of rival selling platforms and e-commerce retailers. In second place comes product development expenses tied to initiatives such as the recent homepage redesign and enhanced landing pages. These tech costs add up to about 12% of revenue each year.
These are expenses that the company can't afford to skimp on. As executives explain in the 10-K, "To compete effectively, we will need to continue to expend significant resources in technology and marketing." It's still an efficient business, given that operating margin has been over 25% of sales in each of the last two years.
Cash flow
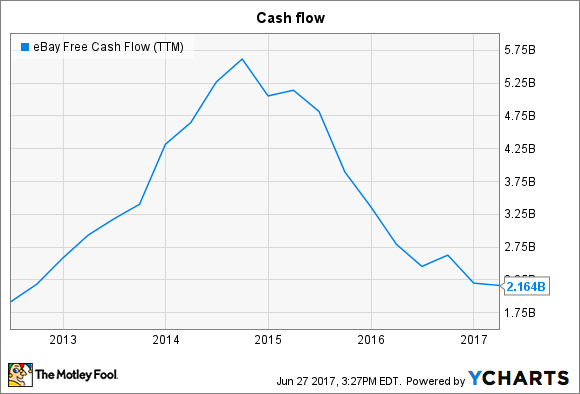
EBAY Free Cash Flow (TTM) data by YCharts.
eBay generates nearly $3 billion in cash flow annually that is reduced by capital expenditures to yield free cash flow of over $2 billion. The company aims to return at least half of that free cash flow haul to investors through stock buybacks, which last year amounted to just over $2 billion. Free cash flow should come in at $2.3 billion for the full 2017 fiscal year.
Revenue outlook

EBAY Revenue (Annual YoY Growth) data by YCharts.
For the full year, eBay CEO Devin Wenig and his executive team are forecasting sales growth of between 5% and 7%, which would keep the company on pace with the gains it logged in 2016.
eBay's major challenges include intense competition and a quick migration to mobile shopping platforms. But executives are encouraged that the improvements they're making to the user experience, on both the buying and selling ends of the transaction, have started paying off in terms of healthier GMV and buyer activity.