Shares of Amazon.com (AMZN +1.60%) are on a tear so far this year, jumping 45% in just the first six months of 2018. Apple (AAPL +4.12%) has been marching steadily higher as well, albeit at a slower pace. The e-commerce giant's stock performance has its market cap now flirting with $900 billion as it races against the Mac maker to the mythical $1 trillion valuation that no company in history has ever achieved...yet.
Amazon's market cap is still trailing by a little over $50 billion, but this race is heating up.
AAPL Market Cap data by YCharts.
How the two tech behemoths compare
While the two companies may be similar in total valuation, they couldn't be further apart with their fundamentals. Apple is the most profitable company on earth, and oftentimes generates more net income in a single quarter than Amazon has in its entire history. Through the first quarter of 2018, Amazon had made $9.6 billion in net income since it was founded. Apple regularly surpasses that lifetime profitability on a quarterly basis. In the fourth quarter alone, Apple's bottom line was more than twice that ($20 billion).

Data source: SEC filings. Chart by author. Amazon lifetime earnings through Q1 2018.
Here's a snapshot of each company's income statement over the past year.
|
Metric |
Apple |
Amazon |
|---|---|---|
|
Revenue |
$247.4 billion |
$193.2 billion |
|
Gross profit |
$94.8 billion |
$44.6 billion |
|
Operating income |
$66.1 billion |
$5 billion |
|
Net income |
$53.3 billion |
$3.9 billion |
|
Gross margin |
38.3% |
19.6% |
|
Operating margin |
26.7% |
1.7% |
|
Net margin |
21.6% |
0.7% |
Data source: Morningstar. All figures shown on a trailing-12-month basis.
There is one notable similarity. Any time there is speculation of either company entering into a new market, shares of incumbents in those markets often tank, as investors fear competing with either company. However, Apple doesn't enter new markets very often, usually one every few years, while Amazon continues to expand into numerous markets, leading to what's now known as the "Amazon effect."

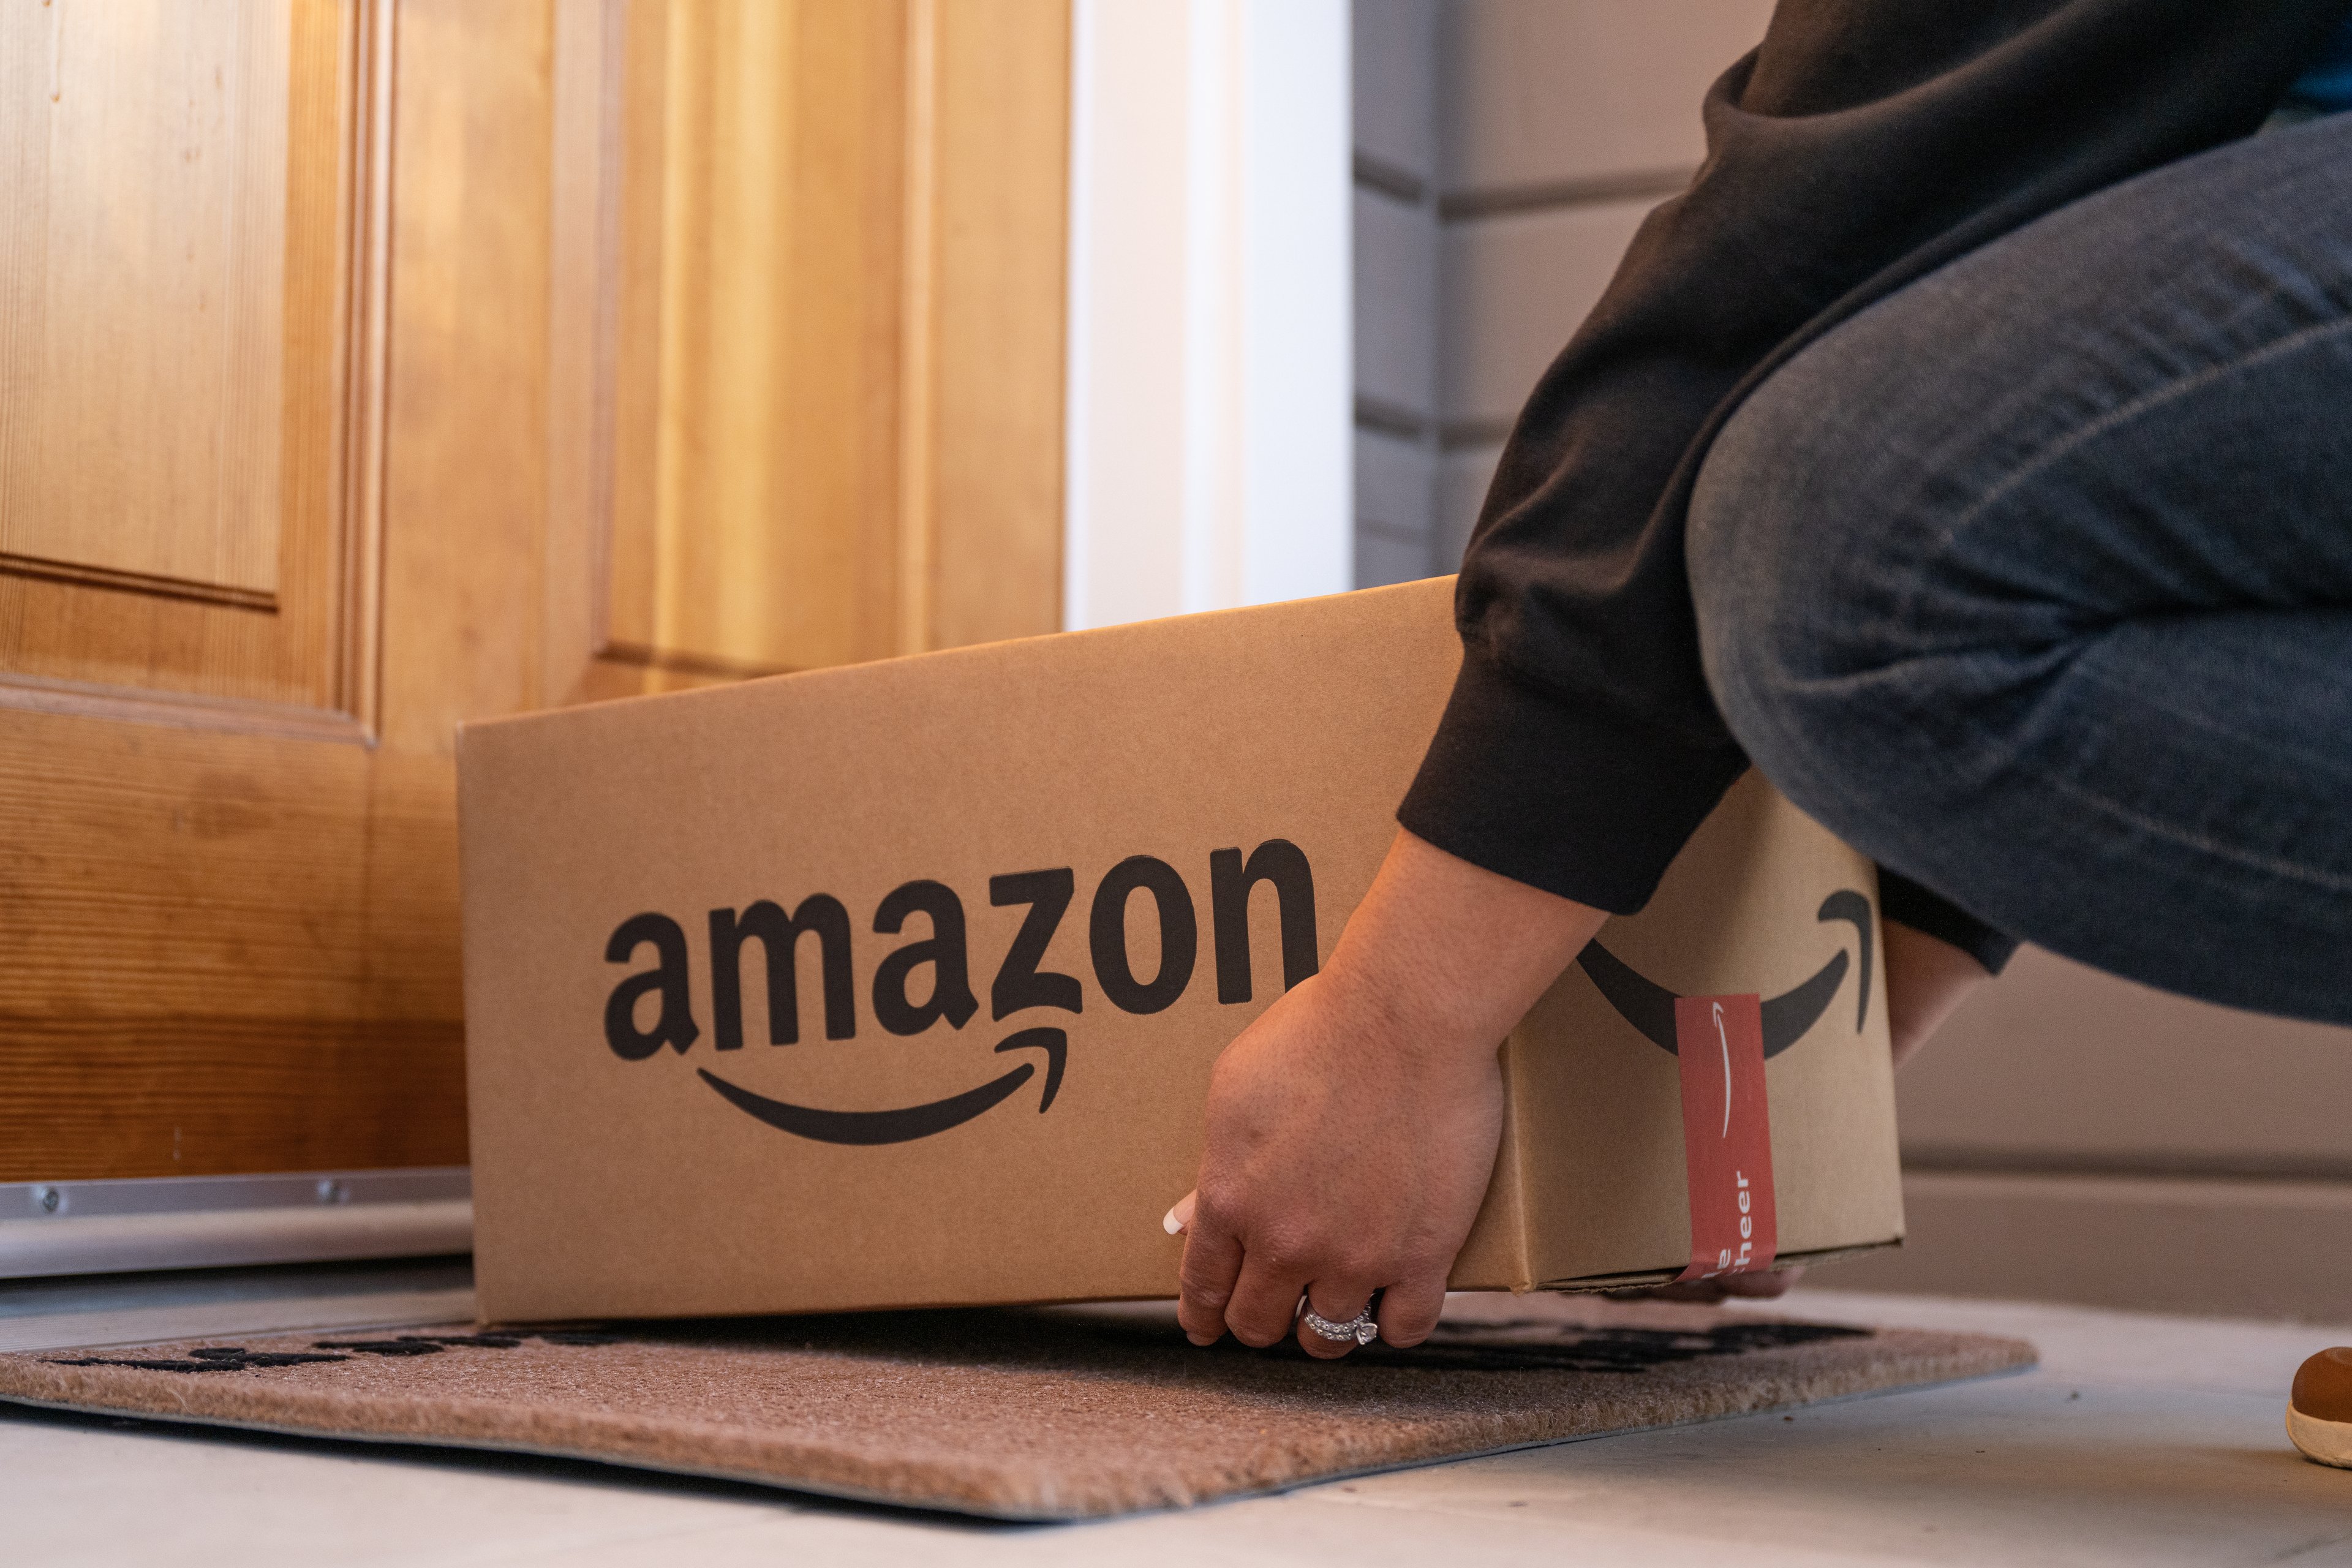
Image source: Amazon.
The stark contrast in financials also means each company's respective valuation metrics are also worlds apart. Apple is incredibly cheap by just about any valuation metric you can think of, trading at a substantial discount to the S&P 500. Amazon, on the other hand, looks astronomically expensive. However, you can partially justify Amazon's premium valuation with much stronger revenue growth, even as Amazon's top line still lags Apple's.
|
Metric |
Apple |
Amazon |
|---|---|---|
|
P/E ratio |
17.7 |
290.6 |
|
P/S ratio |
3.6 |
4.6 |
|
P/CF ratio |
14.1 |
56.4 |
|
Revenue growth |
1.5% |
35.5% |
Data source: Reuters. All figures shown on a trailing-12-month basis.
Investors love both profits and growth, and each company quintessentially embodies one or the other. But which one will be the first to $1 trillion?


