When Chart Industries (GTLS 0.01%) reported third-quarter results on Oct. 17, it left investors generally unimpressed. Earnings and revenue were relatively close to expectations, but management cut guidance for the fourth quarter, lowering its expectations for full-year earnings by about 8%. Taking it out to 2020, Chart also slashed its best-case guidance for 2020 earnings.
Add it all up, and investors have become far less optimistic about Chart's prospects. Its stock price has lost almost 35% of its value over the past six months as pessimism sets in, as well as the tendency for stocks like Chart, with heavy exposure to the energy industry, to follow oil prices up or down.
After taking a closer look at Chart's results, what management said on the earnings call, and how its guidance has changed -- or, more importantly, why it changed -- it looks as if Mr. Market's pessimism has created an excellent opportunity for long-term investors who see the bigger picture to buy shares now. Keep reading to learn my three top reasons Chart Industries is worth buying now.

Image source: Getty Images.
1. The core of Chart's long-term opportunity is growing
While Chart's business is relatively diversified, with exposure to multiple industries and also having a services segment that generates strong, profitable revenues across economic and industry investment cycles, the biggest catalyst for investing in Chart Industries is the global growth in natural gas as an energy source. In its third-quarter earnings presentation, Chart listed more than two dozen LNG projects, both large and small, that are expected to result in booked orders between now and the end of 2020.
But that's looking like just the tip of the iceberg. This slide from the Chart presentation indicates that, even with so much new LNG capacity coming online over the next couple of years, demand growth could outpace new supplies as soon as 2022:

Image source: Chart Industries Q3 2019 earnings presentation.
Chart is already profiting from the growth in LNG supply projects. Through the third quarter, adjusted earnings per share are up 32% from 2018. Moreover, even with its lower full-year guidance, Chart is on track to grow its earnings by around 40% this year. But the real growth is on track to start next year.
2: Chart's revised guidance shows a clearer picture
It might be easy to assume that Chart's lower guidance is bad news. Not only did management lower expectations for the rest of 2019 by about 8% at the midpoint of the adjusted guidance, but they significantly lowered the bar for upside deals in 2020. As recently as three months ago, Chart management was saying it could bring in as much as $2.15 billion in revenue next year, and earn as much as $8.75 per share.
The revised upside guidance calls for $6.15 per share on the high end. That's almost 30% lower than what management said we could expect only three months ago.
Here's the rub: The lower guidance -- both for the rest of this year and 2020 -- isn't the result of Chart losing deals to competitors, or LNG projects getting cancelled. What's actually happening is more of these projects are moving from early planning to firm scheduling, and Chart is starting to get a clearer picture of when it will generate revenue and profits from its part in these projects.
3: Chart stock a lot cheaper than you may think
Chart's shares might not look particularly cheap. At the midpoint of the 2019 guidance for $2.80 per share, Chart trades for almost 22 times expected 2019 earnings, even after its stock price has fallen 35% from the 2019 high:
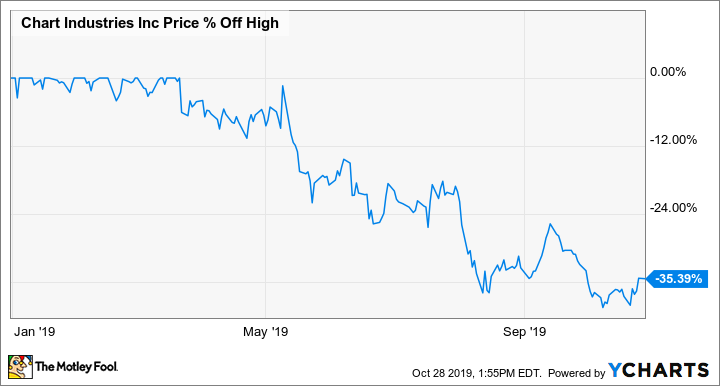
But when you dig a little deeper, and look a little farther, Chart's stock begins to look a lot cheaper. At the midpoint of Chart's 2020 upside outlook, the company expects to earn $5.80 per share on an adjusted basis. That works out to less than 11 times earnings if Chart can bring in even half of the upside deals it has targeted for next year.
Even on a more conservative basis, where we don't count on any of the deals Chart has included in its upside guidance, Chart looks cheap. At the midpoint of its base outlook for 2020, Chart expects to earn $5 per share. That works out to 12.2 times earnings at recent prices. Moreover, as CEO Jill Evanko told investors on the second quarter earnings call, 2020 isn't likely to be the peak of the LNG spending cycle. It could be another five years or longer before the cycle peaks, and it's also likely that the development of LNG export and import facilities will remain high for another decade.
An excellent "buy on the dip" stock
The past six months are an excellent reminder that stock prices move as much on expectations as they do on the results themselves. In Chart's case, the expectations have been very high, and even Chart's solid performance haven't been enough to keep driving the stock price higher, particularly when it's paired with reduced guidance for the next year-plus.
But for patient investors willing to look at the bigger picture, the sell-off over the past six months has created an excellent opportunity to buy. Chart is well-run, has an enormous global tailwind of growth, and trades for excellent value. I can't predict what happens over the next few months, but I expect investors who buy Chart at recent prices should do very well over the next five years.