It's been a roller-coaster ride for Wall Street and investors through nearly seven months of 2025.
In early April, the wheels fell off the wagon, with the benchmark S&P 500 (^GSPC +0.16%), growth-inspired Nasdaq Composite (^IXIC +0.26%), and iconic Dow Jones Industrial Average (^DJI +0.17%) plunging. In a two-day period (the close of April 2 to the end of April 4), the S&P 500 registered its fifth-worst two-day percentage drop (-10.5%) since 1950.
One week after this chaos began, all three major stock indexes recorded their largest single-day point gains in their respective histories -- and they haven't looked back. The broad-based S&P 500 has rallied by more than 25% in just three months for only the sixth time in its history and surged to a record high. Meanwhile, the Nasdaq Composite has surpassed 21,000 for the first time, with the Dow just 4 points away from an all-time closing high, as of July 23.

Image source: Getty Images.
Between the hype surrounding artificial intelligence (AI) and President Donald Trump's administration working out a couple of key trade deals, it would appear nothing can slow down the stock market.
But looks can be deceiving...
Wall Street's benchmark index is primed for a history lesson
Let me preface any and all discussion regarding forecasting tools with this warning: Nothing is guaranteed on Wall Street. Even predictive tools and correlative events that have, historically, been 100% accurate in the past can't concretely guarantee what'll happen in the future.
With the above being said, a 100% historical success rate in forecasting future stock returns is generally something investors should pay attention to.
At any given time, there are one or more headwinds threatening to drag the stock market lower. Uncertainty regarding President Trump's tariff and trade policy, the potential for the prevailing rate of inflation to pick back up, and Moody's downgrade of the U.S. credit rating to AA1 from AAA are all examples of downside catalysts that can spark a stock market correction, bear market, or crash.
But among this laundry list of potential problems for stocks, perhaps nothing is more worrisome than valuations.
Most investors rely on the time-tested price-to-earnings (P/E) ratio when quickly assessing the relative cheapness or priciness of a given stock. A company's P/E ratio is calculated by dividing its share price by its trailing-12-month earnings per share (EPS). It's a handy tool for evaluating mature businesses, but it often falls short with growth stocks and during recessions when corporate earnings are temporarily disrupted.
The valuation tool with an uncanny track record -- i.e., 100% success rate -- of forecasting future stock returns is the S&P 500's Shiller P/E Ratio, which is also known as the cyclically adjusted P/E Ratio, or CAPE Ratio.
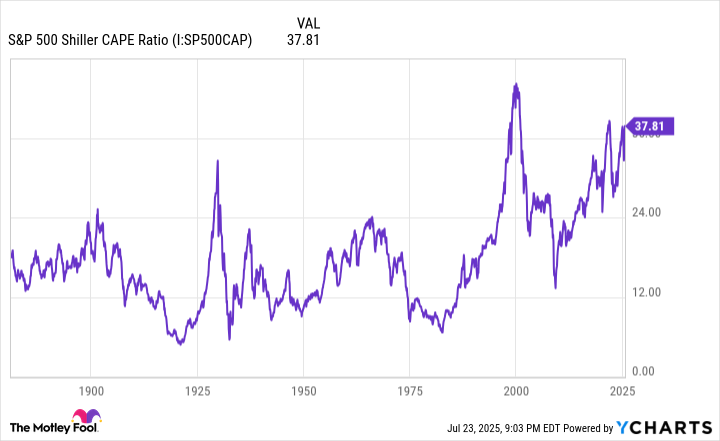
S&P 500 Shiller CAPE Ratio data by YCharts.
Rather than accounting for 12 months of trailing EPS, the Shiller P/E is based on average inflation-adjusted EPS over the trailing-10-year period. Accounting for a decade of EPS and adjusting it for inflation minimizes the impact of economic shock events, which allows for the closest thing to an apples-to-apples comparison as investors can get.
As of the closing bell on July 23, the S&P 500's Shiller P/E Ratio stood at 38.79, which is just fractionally below its high for the current bull market of 38.89, set in December. To put this figure into context, it's the third-priciest continuous bull market when back-tested to January 1871. The only higher readings were observed prior to the dot-com bubble (an all-time peak of 44.19 in December 1999), and immediately prior to the start of the 2022 bear market (just above 40 during the first week of January 2022).
When back-tested 154 years, the Shiller P/E has surpassed a multiple of 30 just six times, including the present -- and this is where historical precedent comes into play.
Following the previous five occurrences where the Shiller P/E topped 30, the S&P 500, Nasdaq Composite, and/or Dow Jones Industrial Average fell between 20% and 89% (this latter figure is a Great Depression outlier). What this signals is that extended valuations aren't well tolerated by Wall Street over an extended period.
Furthermore, none of these five 20% (or greater) pullbacks in the broader market found their respective bottoms with the S&P 500's Shiller P/E higher than 27. In other words, the minimum historical expectation is for the Shiller P/E to retrace to 27. Were this to occur, the broad-based S&P 500 would need to lose about 30% of its value.
Based solely on what this valuation forecasting tool tells us, Wall Street's benchmark index can lose 30% of its value at some point in the presumed not-too-distant future.

Image source: Getty Images.
Time in the market consistently trumps trying to time the market
Thankfully, history is a pendulum that swings (disproportionately) in both directions. Although sizable moves lower in the S&P 500, Nasdaq Composite, and Dow Jones Industrial Average can play on the emotions of investors, time and perspective have a way of rewarding those who exercise patience and focus on the horizon.
Every year, the analysts at Crestmont Research refresh a published data set that examines the rolling 20-year total returns (including dividends) for the S&P 500 that dates back to the start of the 20th century. Despite the S&P not officially being incepted until 1923, researchers were able to tabulate total return data by tracking the performance of its components in other major indexes back to 1900. This yielded 106 rolling 20-year periods (1900-1919, 1901-1920, 1902-1921, and so on, to 2005-2024).
What Crestmont's calculations show is that all 106 of these rolling 20-year periods produced a positive total return. Hypothetically (because an S&P 500 index fund has only existed since 1993), if an investor had purchased an S&P 500 index fund at any point between 1900 and 2005 and simply held this position for 20 years, they would have generated a profit, including dividends, 100% of the time.
What's particularly powerful about Crestmont's analysis is these positive returns occurred despite numerous recessions, a few economic depressions, two pandemics, and multiple wars. No matter how dire things seemed for Wall Street at any given moment, investors who held for 20 years always came out ahead.
To build on this point and demonstrate how important time in the market is relative to trying to time its inevitable downturns, let's take a closer look at another data set published by Bespoke Investment Group on X (formerly Twitter) in June 2023.
It's official. A new bull market is confirmed.
-- Bespoke (@bespokeinvest) June 8, 2023
The S&P 500 is now up 20% from its 10/12/22 closing low. The prior bear market saw the index fall 25.4% over 282 days.
Read more at https://t.co/H4p1RcpfIn. pic.twitter.com/tnRz1wdonp
The data set you see above represents a comparison of the calendar-day length of every S&P 500 bull and bear market since the start of the Great Depression in September 1929.
The 27 bear markets in the broad-based index spanning nearly 94 years (until June 2023) lasted an average of 286 calendar days, or less than 10 months. In comparison, bull markets have averaged 1,011 calendar days, or approximately 3.5 times longer than the typical bear market.
Further, the longest S&P 500 bear market since the Great Depression endured for 630 calendar days in the mid-1970s. Including the current bull market (extrapolated to present day), more than half (14 out of 27) of S&P 500 bull markets have lasted longer than 630 calendar days.
If the Shiller P/E correctly forecasts a 30% decline in the benchmark S&P 500, long-term-minded investors should use it as an opportunity to invest for their future, knowing that time and history are firmly in their corner.