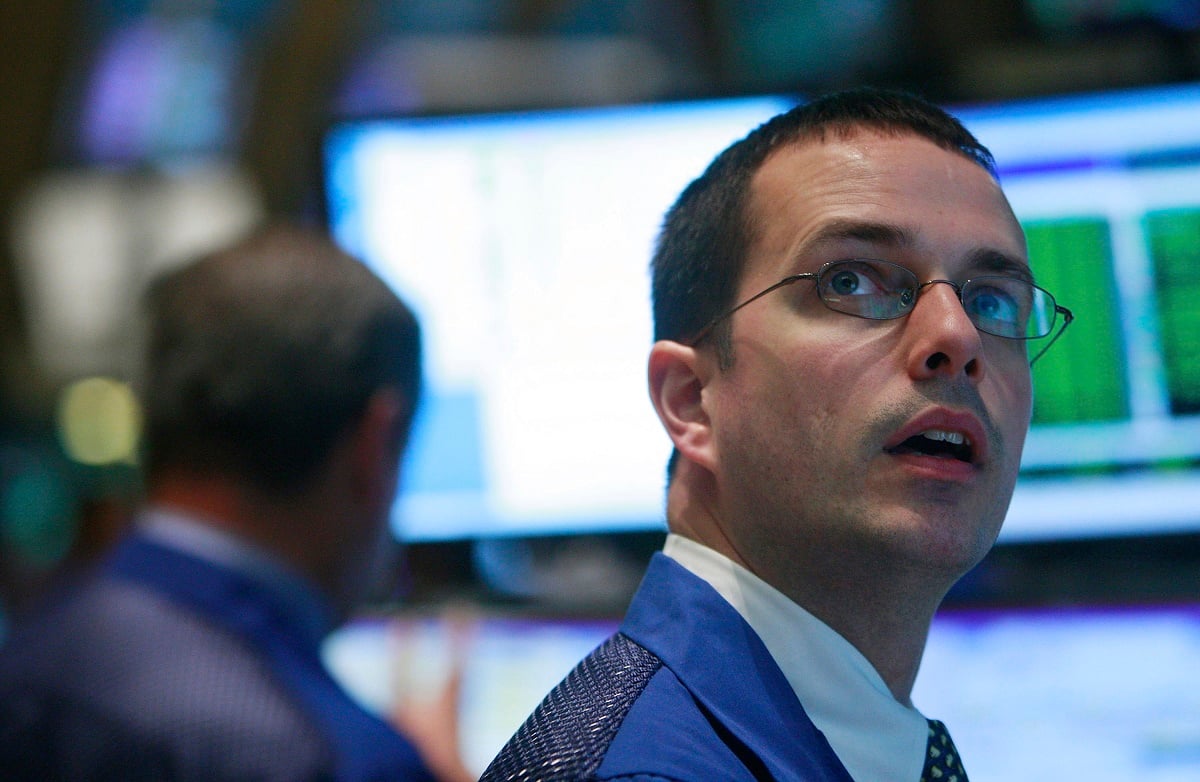
More than 5,400 companies were listed on U.S. stock exchanges as of June 30, according to the Securities Industry and Financial Markets Association (SIFMA).
Many of those companies are included in major stock indexes that measure various aspects of the domestic market. But the S&P 500 (^GSPC +0.03%) is widely considered the best benchmark for the overall U.S. stock market due to its breadth and selection methodology.
Read on to see the S&P 500's average return during the last decade and what Wall Street analysts expect in the remaining months of 2025.

Image source: Getty Images.
The S&P 500 returned 13.6% annually during the last decade
The S&P 500 was created in 1957. The index measures the performance of 500 large-cap U.S. companies that account for more than 80% of domestic equities by market value. Inclusion is at the discretion of a selection committee, but companies must satisfy certain criteria to be eligible: GAAP profitability, sufficient liquidity, and a minimum market value of $22.7 billion.
The index is rebalanced quarterly after the U.S. markets close on the third Friday of March, June, September, and December. But companies can be added at any time. For instance, Datadog, The Trade Desk and Block joined the S&P 500 in July. The largest holdings in the index are listed by weight below:
- Nvidia: 7.3%
- Microsoft: 7%
- Apple: 5.8%
- Amazon: 3.9%
- Alphabet: 3.5%
- Meta Platforms: 3%
- Broadcom: 2.4%
- Berkshire Hathaway: 1.6%
- Tesla: 1.6%
- JPMorgan Chase: 1.5%
Excluding dividends, the S&P 500 returned 202% in the last decade, compounding at 11.6% annually. Including dividends, the index returned 261%, compounding at 13.6% annually. That period covers a broad range of economic and market environments, so similar returns are possible in the next decade.

SNPINDEX: ^GSPC
Key Data Points
What Wall Street expects from the U.S. stock market in 2025
The S&P 500 has yo-yoed this year. The benchmark index initially crashed when President Trump announced sweeping tariffs in March and April, but staged a historic recovery when he subsequently paused the most severe duties to leave room for trade negotiations.
Meanwhile, S&P 500 earnings crushed expectations in the first quarter as the U.S. economy stayed resilient despite stark changes to trade policy. Hiring topped forecasts in June, while unemployment unexpectedly fell to 4.1%. And second-quarter GDP increased at an annual rate of 3%, above the consensus estimate that called for 2.4% growth.
Accordingly, many Wall Street analysts initially cut their year-end forecasts for the S&P 500, but have since revised their estimates higher. The chart below shows where 17 investment banks and research firms think the index will finish 2025.
|
Wall Street Firm |
S&P 500 Year-End Target |
Implied Upside (Downside) |
|---|---|---|
|
Oppenheimer |
7,100 |
11% |
|
Wells Fargo |
7,007 |
10% |
|
BMO Capital |
6,700 |
5% |
|
Goldman Sachs |
6,600 |
3% |
|
Fundstrat |
6,600 |
3% |
|
Deutsche Bank |
6,550 |
3% |
|
Morgan Stanley |
6,500 |
2% |
|
Yardeni Research |
6,500 |
2% |
|
UBS |
6,400 |
0% |
|
Bank of America |
6,300 |
(1%) |
|
Citigroup |
6,300 |
(1%) |
|
RBC Capital |
6,250 |
(2%) |
|
Barclays |
6,050 |
(5%) |
|
JPMorgan |
6,000 |
(6%) |
|
Evercore |
5,600 |
(12%) |
|
HSBC |
5,600 |
(12%) |
|
Stifel |
5,500 |
(14%) |
|
Median |
6,400 |
0% |
Source: Yahoo Finance.
As shown above, the S&P 500 has a median year-end target of 6,400 among 17 Wall Street analysts. That essentially implies no change from its current level of 6,380, which means strategists generally expect the index to trade sideways in the remaining months of 2025. That may surprise readers given the S&P 500 has been roaring through record highs in recent weeks.
However, investors should bear in mind that any changes to trade policy could force another wave of revisions, and existing tariffs may pose a greater threat to the economy than implied by Wall Street's current outlook. It makes sense to proceed cautiously in the current market environment.


