For the better part of the last 16 years (since the Great Recession ended), the broad-based S&P 500 (^GSPC +0.70%), iconic Dow Jones Industrial Average (^DJI +0.53%), and growth stock-dominated Nasdaq Composite (^IXIC +1.00%) have been unstoppable.
Despite a period of heightened volatility in late March and early April, the S&P 500, Dow Jones, and Nasdaq Composite have all blasted to multiple record-closing highs in 2025. The catalysts fueling this rally include the evolution of artificial intelligence (AI), an expectation that the Federal Reserve will continue to cut interest rates, and a forthcoming resolution to tariff-related uncertainty.
But as stocks have risen, so have valuations. By one measure (which I'll get into in greater detail in a moment), this is the second-priciest stock market when looking back 154 years.

Image source: Getty Images.
While historically pricey stock markets have always foreshadowed an eventual (keyword!) meaningful decline for the S&P 500, Dow, and Nasdaq Composite, some Wall Street analysts and pundits suggest higher valuations are "the new normal." However, this argument isn't as black-and-white as it appears.
Is the stock market in a "new normal?" Yes, but not for the reasons being touted.
Last week, equity analyst Savita Subramanian of Bank of America stated in a client note, "Perhaps we should anchor to today's multiples as the new normal rather than expecting mean reversion to a bygone era."
In other words, Subramanian points to the rapid growth associated with the rise of AI and resilient earnings for Wall Street's most-influential businesses, as a whole, as her reasoning for ignoring more than a century of historical valuation data. And Subramanian isn't alone, with other analysts and pundits viewing growth from the "Magnificent Seven" as all the more reason to believe valuations aren't egregiously high.
While this might sound like a valid argument on paper, looking back at the S&P 500's Shiller price-to-earnings (P/E) Ratio over the last 35 years tells a more comprehensive story. Note: the Shiller P/E is also known as the cyclically adjusted P/E Ratio (CAPE Ratio).
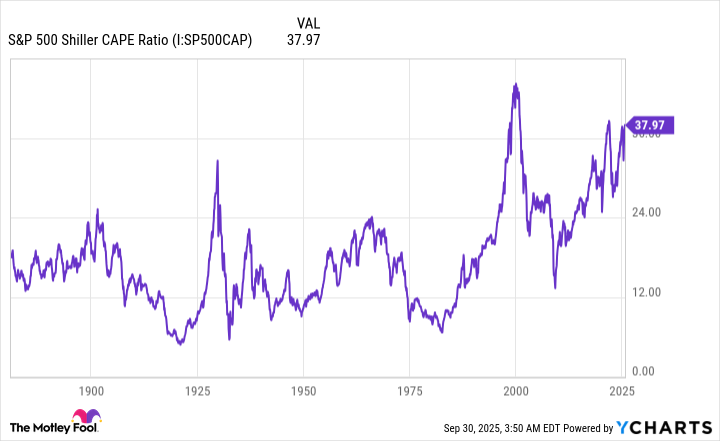
S&P 500 Shiller CAPE Ratio data by YCharts.
The "new normal" for stocks didn't begin with the rise of AI. Rather, it began in the mid-1990s with the advent and proliferation of the internet.
Prior to the internet, a definitive information barrier existed between Wall Street and Main Street. If you wanted to find out what moved markets, you'd need to watch a news program on TV or read the paper the following day.
When the internet became mainstream, it broke down these information barriers and put everyday investors on a level playing field with Wall Street. Income statements, balance sheets, annual reports, investor presentations, management commentary, and market-moving headlines were instantly accessible at the click of a button.
Additionally, interest rates fell pretty steadily from 1990 through the 2010s. When access to capital becomes progressively cheaper, businesses are more apt to borrow in order to fuel hiring, innovation, and mergers and acquisitions.
Although it's easy to suggest that AI is the reason we should be willing to accept higher valuation premiums for Mag-7 stocks and the broader market as a whole, the catalysts that spurred an expansion in valuation multiples were put into motion decades ago. Whereas a Shiller P/E ranging from 10 to 20 was commonplace from 1871 to 1995, a Shiller P/E of 20 to 30 is more common now. Lower interest rates and easier access to information have spurred a new normal in this sense.
However (and this is a big "however"), this doesn't mean current valuations make sense.

Image source: Getty Images.
This is the second-priciest stock market in over 150 years
To preface the point I'm about to make, there isn't a metric or correlative event that can concretely guarantee what the stock market is going to do next. If such a measure did exist, you can be assured that every investor would be taking advantage of it.
But there are correlative events that have phenomenal track records of forecasting the future. The S&P 500's Shiller P/E is one such measure that has a flawless history of foreshadowing trouble.
When looking back to January 1871, there have only been six instances where this valuation tool has topped a multiple of 30 for at least a two-month period during a bull market:
- August and September 1929: In the months leading up to the Great Depression, the Shiller P/E briefly topped 30 for the very first time. The Dow Jones Industrial Average would lose 89% of its value on a peak-to-trough basis during the Great Depression.
- June 1997 to August 2001: The S&P 500's Shiller P/E reached its all-time high of 44.19 in December 1999, which is mere months before the dot-com bubble burst. The S&P 500 and Nasdaq Composite respectively shed 49% and 78% of their value when the bubble burst.
- September 2017 to November 2018: The third time the Shiller P/E surpassed 30 was eventually followed by a fourth quarter tumble in 2018 that saw the S&P 500 lose 20% of its value.
- December 2019 to February 2020: Just prior to the COVID-19 pandemic, the Shiller P/E topped 30, which was followed by a 33% crash in the S&P 500 spanning five weeks in February-March 2020.
- August 2020 to May 2022: During the first week of January 2022, the S&P 500's Shiller P/E hit what's now its third-highest multiple in its back-tested history (a few hundredths above 40). The ensuing 2022 bear market wiped out roughly a quarter of the S&P 500's value.
- November 2023 to present: The sixth occurrence is ongoing, with the Shiller P/E peaking at a multiple of 40.15 during the current bull market.
The Shiller PE cracked 40 for the first time since 2000.
-- Tobias Carlisle (@Greenbackd) September 23, 2025
Only the December 1999 summit at 44.19x remains, ya filthy animals. pic.twitter.com/Dja4rMWuoD
The point of these six occurrences is to demonstrate that readings of 30 or higher aren't well-tolerated over extended periods. Every single instance has eventually given way to a decline in the major indexes ranging from 20% to 89%.
It's important to note that the Shiller P/E isn't is a timing tool. Sometimes we see stocks roll over after a few months. Other times, they can remain pricey for years, as we witnessed prior to the bursting of the dot-com bubble. But make no mistake, every multiple above 30 has been met with eventual significant selling pressure.
Something else to consider is that every next-big-thing trend over the last 30-plus years has navigated its way through a bubble-bursting event. Investors have consistently overestimated the early adoption and/or utility of game-changing technologies.
For instance, even though AI revenue projections are through the roof, most businesses aren't yet optimizing their AI solutions, nor generating a positive return on their AI investments. These are hallmarks of AI potentially being in a bubble that'll eventually burst.
Though we've been in a new normal for valuations since the mid-1990s, there's little question that stocks are historically pricey right now. History is quite clear that anchoring to valuations this high would be a mistake.