With less than 10 weeks left before we turn the page on 2025, it's looking as if optimists will be celebrating another banner year. Though the stock market going up isn't out of the norm -- roughly 70% of all years from 1926 to 2024 resulted in positive stock market returns -- the voracious rally in the benchmark S&P 500 (^GSPC +0.03%), ageless Dow Jones Industrial Average (^DJI 0.58%), and growth stock-dominated Nasdaq Composite (^IXIC +0.28%) has been something special.
Since the tariff-related mini-crash resolved on April 8, the S&P 500, Dow Jones, and Nasdaq Composite have catapulted higher by 35%, 24%, and 51%, respectively. It's also only the sixth time we've witnessed Wall Street's benchmark index gain 25% in a three-month period, dating back to 1950.
While seemingly nothing can go wrong for stocks, this doesn't mean danger isn't lurking. In fact, one new data point might be the strongest evidence yet that Wall Street is in a sizable bubble that's eventually (keyword!) going to burst.

Image source: Getty Images.
What we already know: Valuations are historically high
What's been known for quite some time is that stock valuations are in nosebleed territory.
To preface the following discussion, "value" isn't something that comes with a defined blueprint or a concrete meaning. Every investor can value stocks differently, which why the stock market is a market in the first place.
The usual go-to when valuing stocks or the broader market is the time-tested price-to-earnings (P/E) ratio, which is arrived at by dividing a company's share price by its trailing-12-month earnings per share (EPS). The potential shortcomings with the P/E ratio are that it doesn't account for a company's growth rate and becomes somewhat useless during economic downturns.
The more-encompassing valuation tool that's raising red flags is the S&P 500's Shiller P/E Ratio, which is also referred to as the cyclically adjusted P/E Ratio, or CAPE Ratio. The Shiller P/E is based on average inflation-adjusted EPS over the prior 10-year period, which means it's resilient to recessions and shock events skewing its readings.
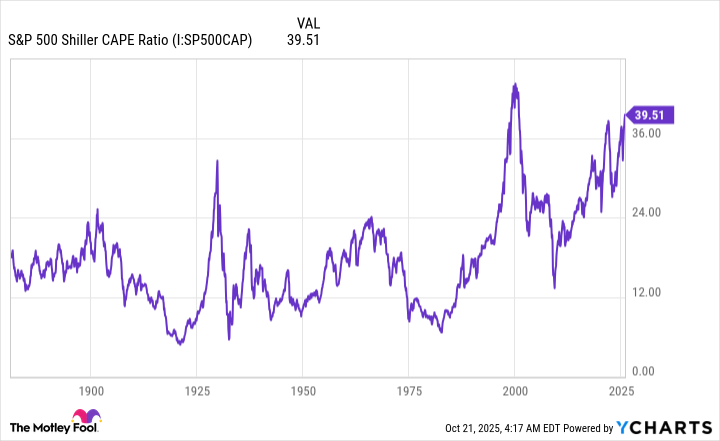
S&P 500 Shiller CAPE Ratio data by YCharts.
When back-tested to January 1871, the S&P 500's Shiller P/E has averaged a reading of 17.29. But improved access to information, the proliferation of online trading, and lower interest rates (compared to prior decades), have fueled risk-taking and multiple expansion on Wall Street.
Recently, the Shiller P/E hit 40.33, which is the highest reading during the current bull market, and the second-highest multiple during a continuous bull market when looking back 154 years. The only other time stocks have been collectively pricier is in the months prior to the dot-com bubble bursting (a peak of 44.19 in December 1999).
History tells us that valuation premiums of this magnitude aren't sustainable. The five previous occurrences throughout history where the Shiller P/E Ratio topped 30 and held that level for at least a two-month period were eventually followed by declines in the major stock indexes ranging from 20% to 89%. In other words, CAPE Ratio readings north of 30 are something of a ticking time bomb for Wall Street.
However, new data suggests just how much of a bubble the stock market might be in.
Wall Street just hit a fresh record -- and this one shouldn't be cheered
Earlier this week, Kurt Altrichter, CRPS®, a financial advisor and portfolio manager, posted the following on X (formerly Twitter):
When the next major crash hits, there will be signs, and this is one of them.
-- Kurt S. Altrichter, CRPS® (@kurtsaltrichter) October 19, 2025
The number of leveraged equity ETFs just hit a record 701.
When leverage becomes a product, not a tool, it tells you where we are in the cycle... pic.twitter.com/NdSrDnr9vx
The cumulative number of leveraged equity exchange-traded funds (ETFs) surpassed 700 in October 2025, which is up in the neighborhood of 40% on a year-over-year basis and has nearly tripled since the COVID-19 pandemic took shape.
Leveraged ETFs lean on derivatives and debt, such as swaps and futures contracts, to amplify the daily return potential of an underlying asset. Levered instruments like this were first introduced 19 years ago by ProShares, with these ETFs providing investors with 2X or 3X leverage to underlying indexes, such as the Dow Jones Industrial Average.
In 2022, single-stock 2X levered ETFs began to crop up, which gave investors a way to magnify their returns in individual stocks. Between the third quarter of 2022 and the fourth quarter of 2024, the number of single-stock ETFs jumped from 17 to 102, with roughly 60% of these funds being levered.
While these levered instruments can incite visions of riches in the minds of investors amid a historically bullish stock market, they're potentially a trap of epic proportions.
Based on data from Morningstar, 55% of all levered ETFs eventually closed down, while 17% have gone on to lose more than 98% of their value.
The decision for select companies to file for new leveraged ETF and single-stock products, including potential 5X-levered ETFs, comes at a time when U.S. margin debt hit an all-time record of $1.13 trillion in August, according to data from FINRA. The willingness of investors to take outsize risks and allow the fear of missing out (FOMO) to get the better of them demonstrates what a potentially dangerous bubble that the stock market currently finds itself in.

Image source: Getty Images.
There's no need to use leverage when history conclusively favors optimistic long-term investors
Though select valuation data and a rapidly rising leveraged ETF count are both harbingers of trouble for the stock market, one thing investors absolutely have in their corner is history. While it might not always be their friend over the coming months or even the next year, it's consistently an ally when examining the performance of equities over long periods.
To state the obvious, stock market corrections, bear markets, and even those infamous elevator-down crashes are normal, healthy, and inevitable aspects of the investing cycle. Let's call it the price of admission for access to the greatest wealth creator on the planet.
But this price of admission also comes with the historical advantage of being short-lived.
In June 2023, shortly after the S&P 500 was confirmed to be in a new bull market, the researchers at Bespoke Investment Group published a data set to X that compared the length of 27 separate S&P 500 bull and bear markets since the start of the Great Depression in September 1929. What Bespoke discovered was an expected but still jaw-dropping difference between optimism and pessimism on Wall Street.
It's official. A new bull market is confirmed.
-- Bespoke (@bespokeinvest) June 8, 2023
The S&P 500 is now up 20% from its 10/12/22 closing low. The prior bear market saw the index fall 25.4% over 282 days.
Read more at https://t.co/H4p1RcpfIn. pic.twitter.com/tnRz1wdonp
Even though bear markets inspire fear and can tug on the heartstrings of investors, the average S&P 500 bear market has lasted just 286 calendar days, or roughly 9.5 months. Only eight out of 27 bear markets reached the one-year mark.
In comparison, the typical bull market in the span of almost 94 years (September 1929 – June 2023) persisted for 1,011 calendar days, or approximately two years and nine months.
What's more, the benchmark S&P 500 has generated a positive return 94% of the time on a rolling-10-year basis, dating back to 1926, and has never delivered a negative total return, including dividends, over any rolling 20-year period.
If you give stocks and the U.S. economy ample time, history shows they come through for investors.