Thanks to better-than-expected third-quarter sales and earnings results, as well as an aggressive outlook for continued investments in artificial intelligence (AI), Amazon (AMZN 0.96%) closed out October with a bang, surging to a new all-time high and boosting its market cap to $2.6 trillion.
The record high is noteworthy because only a week before, the Seattle-based e-commerce and cloud computing giant was lagging its peers in both the Consumer Discretionary Sector SPDR Fund (XLY +0.23%) and the SPDR S&P Retail ETF (XRT 0.54%) for most of this year. But thanks to its late-month double-digit rally, it pushed back into the lead.
Although Amazon is still trailing the S&P 500 this year, that gap has been narrowed to roughly 5 percentage points as of the close of trade on Oct. 31.

NASDAQ: AMZN
Key Data Points
The main question facing both current and would-be investors now is: Can the rally last?
I would argue it can -- and will -- last, and highlight three key valuation metrics that suggest Amazon will be at least 50% higher three years from now.
The P/E puzzle
The first and most basic measure of Amazon's future potential value is its forward P/E, which currently sits at 31.6 times projected earnings per share over the next 12 months. Interestingly, this number is both high and low depending on how you look at it.
For example, using Koyfin data and a 10-year look back, a P/E of 31 would land Amazon in the top 15% compared to the consumer discretionary sector as well as the S&P 500. In other words, that means over 85% of stocks could be bought at a lower multiple right now than Amazon.
Where things get complicated, however, is when you compare Amazon's present P/E to itself over the past decade, and that 31 valuation suddenly drops down to the fifth percentile -- meaning the stock is currently cheaper by that measure than it's been 95% of the time since 2015.
As the chart below shows, the past 10 years have been very good for Amazon investors.
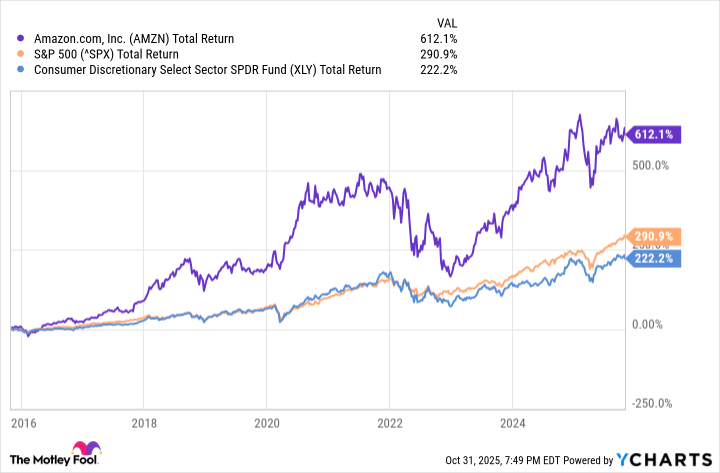
AMZN Total Return Level data by YCharts
In terms of upside potential, if Amazon simply maintains its historically low forward P/E ratio of 31, and hits the average analyst full-year earnings-per-share (EPS) estimate of $11.55 for 2028, the stock would be trading around $360, which is roughly 50% higher than current levels.
Other metrics
Like the forward P/E ratio, analysts have also baked in several years of revenue growth and cash-flow improvements extending to 2028 and beyond.
For example, current estimates project Amazon's cash flow per share will nearly double over the next three years, going from about $12.50 this year to $24.68 in 2028.
At the same time, analysts peg full-year revenue to rise at least 10% a year for the next three years, going from an estimated $713 billion in 2025 to $977 billion in 2028. If they're right, that works out to 37% -- or $264 billion -- of top-line growth over the next three years.

Image source: Amazon.
For what it's worth, over the past three years, Amazon beat consensus sales estimates 11 of 12 times, meaning a steady price-to-sales ratio would imply about 40% upside.
While the math and projections seem plausible, it's important to remember that massive multinational businesses like Amazon always face unforeseen risks and events that can quickly ruin a good growth story and wipe out market gains.
That said, given the company's long-term track record of delivering results, growing market share and margins, and its continuing investments into tech and AI, existing shareholders may want to hang tight (or selectively add to positions) and new investors use any weakness as a potential entry point.