It is no secret that stock valuations, especially among large-cap stocks, are running hot. After a bull market that's run for more than three years, with the S&P 500 returning 23%, 24%, and 16%, respectively, in the last three calendar years, valuations were bound to rise.
But they have reached historically high levels, at least according to one key valuation metric, the Shiller P/E ratio, also known as the cyclically adjusted P/E (CAPE) ratio.
The Shiller P/E ratio, named for the man who developed it, Nobel laureate economist Robert Shiller, looks at the market price of an index, typically the S&P 500, in relation to the inflation-adjusted earnings over a 10-year period.

Image source: Getty Images.
The longer-term view smooths out the effects of short-term earnings volatility and gives investors a broader view of market valuations than the typical one-year snapshot. It is designed to give investors a sense of where the larger market stands and where it might be heading.
Currently, the Shiller P/E ratio stands at 39.85. Why is that significant? Because it is the highest it has been since July of 2000 -- more than 25 years ago, at the height of the dot-com boom. That's even higher than in October 2021, when it reached 38 at the height of the post-COVID technology boom.
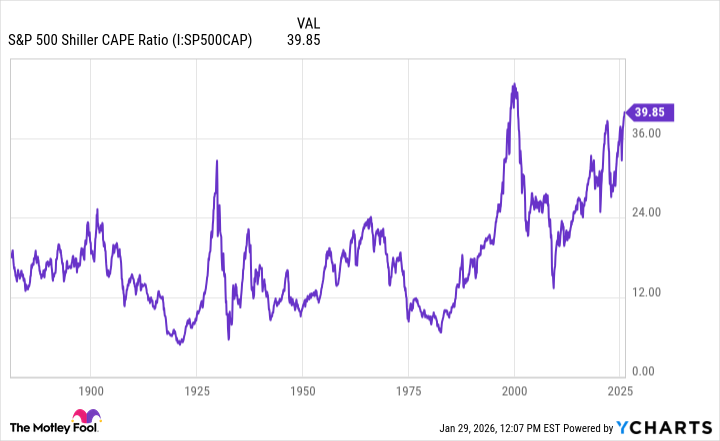
Data by YCharts.
Boom and bust?
I probably don't need to remind you what followed both of those past Shiller P/E peaks, but in case some are unaware, the markets crashed.
In 2000, the dot-com boom turned to bust, and the S&P 500 endured a three-year bear market, from 2000 through 2002. Over those three years, the large-cap benchmark sank 9%, 12%, and 22%, respectively. By January 2003, the Shiller P/E ratio had dropped to 21, which was in a normal historical range.
After the 2021 peak, the S&P 500 fell 18% in 2022 before recovering in 2023, with the Shiller P/E ratio retreating to 28 in April of that year.
Does this mean that the market is headed for a major correction in 2026 or perhaps 2027? It is impossible to know with any certainty, but historically, when the Shiller P/E ratio has spiked, a downturn has followed.
When valuations are that high, earnings have to keep increasing to justify such high stock prices. If they don't, for whatever reason, including macroeconomic forces, investors will look for less risky places to invest their money, including bonds, commodities, small caps, and value stocks. This, in turn, would spark a sell-off among overvalued large caps -- which make up a disproportionately large percentage of the total market value -- causing stock prices to drop.
Again, it's impossible to know if a correction or bear market will follow this historically high Shiller P/E ratio. Some analysts argue that the artificial intelligence boom is increasing earnings and productivity and can justify the high prices. That may be true, but investors should prepare for the worst. That means being mindful of the P/E ratios of the stocks you invest in. If they are way higher than historical averages, that could be a red flag.