For the better part of President Donald Trump's first term in the White House, the stock market was unstoppable. By the time he left office in January 2021, the ageless Dow Jones Industrial Average (^DJI 0.36%), benchmark S&P 500 (^GSPC 0.43%), and growth-focused Nasdaq Composite (^IXIC 0.94%) had soared by 57%, 70%, and 142%, respectively. It marked one of the highest annualized returns overseen by any president, dating back to the late 1800s.
Trump's second, non-consecutive stint as president has begun in a similar fashion -- with big stock gains. Between Inauguration Day (Jan. 20, 2025) and the time of this writing (Jan. 28, 2026), the Dow, S&P 500, and Nasdaq Composite have rallied by 13%, 16%, and 22%, respectively.

President Trump delivering the State of the Union address. Image source: Official White House Photo.
But these outsize gains haven't been without their fair share of stock market drama. In February-March 2020, during the early stages of the COVID-19 pandemic, a 33-calendar-day crash wiped out 34% of the S&P 500's value.
More recently, a two-day stretch (from the closing bell on April 2 to the end of trading on April 4) that followed the unveiling of President Trump's tariff and trade policy resulted in Wall Street's benchmark index losing 10.5% of its value. This marked its fifth-steepest two-day decline in history, dating back to 1950.
With two historic stock market crashes during Trump's tenure, it's time to let historical data weigh in on the likelihood of a third crash being imminent.
Here's what history has to say about another stock market crash under Trump
Before proceeding, take note that while history does tend to rhyme on Wall Street, it can't guarantee that something will happen in the future. Nevertheless, past correlations can often predict what's to come.
One of the historical markers that doesn't bode particularly well for Wall Street is its expensive valuation, as measured by the S&P 500's Shiller Price-to-Earnings (P/E) Ratio, which is also known as the cyclically adjusted P/E Ratio, or CAPE Ratio.
S&P 500 Shiller PE Ratio hits 2nd highest level in history 🚨 The highest was the Dot Com Bubble 🤯 pic.twitter.com/Lx634H7xKa
-- Barchart (@Barchart) December 28, 2025
When back-tested to January 1871, this valuation tool, which is based on average inflation-adjusted earnings over the trailing decade, has averaged 17.33. As of the closing bell on Jan. 28, the CAPE Ratio clocked in above 41. This is the second-priciest stock market in history, according to this indicator, and is within striking distance of the highest-ever multiple of 44.19, set mere months before the dot-com bubble burst.
Although it's impossible to predict how long valuations will remain extended, the Shiller P/E has an exceptional track record of foreshadowing significant declines. The CAPE Ratio has only exceeded 30 on six occasions in 155 years, with the previous five instances followed by drops in the Dow, S&P 500, and/or Nasdaq ranging from 20% to 89%.
Another piece of history that threatens to upend the bull market President Trump is overseeing is his aforementioned tariff and trade policy.
In December 2024, four New York Federal Reserve economists, writing for Liberty Street Economics, published a report ("Do Import Tariffs Protect U.S. Firms?") that examined the performance of stocks following the implementation of Trump's China tariffs in 2018-2019. The economists found that companies directly affected by these tariffs endured, on average, declines in labor productivity, employment, sales, and profits from 2019 to 2021. In other words, the negative impact from tariffs lasted far beyond Trump's initial announcement.
But while the Shiller P/E and Liberty Street Economics report both point to notable downside for the Dow Jones Industrial Average, S&P 500, and Nasdaq Composite, neither suggests a stock market crash is imminent. Although things could certainly be far more challenging for stocks during Trump's second term in the White House, the data doesn't indicate an elevator-down move is forthcoming.

Image source: Getty Images.
Perspective and optimism are investors' top allies
To be objective, most investors aren't thrilled when they see a portfolio of red arrows. However, these moments of emotion-driven pessimism have the potential to turn into generational buying opportunities for optimistic, long-term-minded investors.
The only guarantee investors have when examining short investing time frames is unpredictability. Stock market corrections, bear markets, and even feared stock market crashes are normal, inevitable, and arguably healthy events that are part of the investing cycle. The catch is that these events are historically short-lived.
For example, the COVID-19 crash wiped out just over a third of the S&P 500's value in less than five weeks. But just six months after hitting its pre-COVID-19 crash peak, the benchmark index had reached a new high. The S&P 500 has gone on to more than double since August 2020.
It's a similar story following Donald Trump's tariff-driven crash in early April 2025. Despite nosediving over a four-day trading period, Wall Street's highly followed stock index had recouped everything that was lost one month later. Furthermore, the three-month gains for the S&P 500 following this short-lived crash are some of the strongest in the index's history.
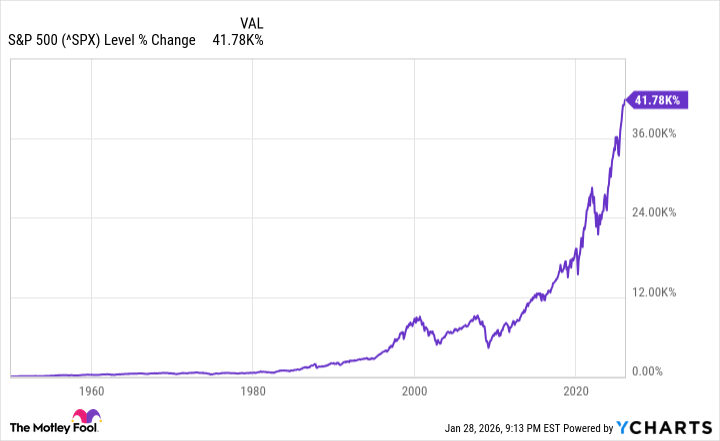
^SPX data by YCharts. S&P 500 returns from Jan. 3, 1950-Jan. 28, 2026.
If investors maintain perspective and take a step back when the stock market becomes volatile or unpredictable, their view of equities is likely to change. Whereas short-term directional moves for the Dow Jones Industrial Average, S&P 500, and Nasdaq Composite are unpredictable, multidecade directional predictions for these indexes have been much more certain.
Every year, analysts at Crestmont Research publish a data set that calculates the rolling 20-year total returns, including dividends, of the S&P 500. These calculations date back to the start of the 20th century.
In total, Crestmont examined 107 rolling 20-year periods (1900-1919, 1901-1920, and so on, to 2006-2025) and found that all 107 generated a positive annualized total return. No matter what obstacles were thrown the stock market's way, the S&P 500 has a 100% success rate of heading higher over every 20-year period, dating back more than a century.
If a stock market correction, bear market, or elevator-down move does take shape under President Trump, maintaining perspective, being optimistic, and positioning your investment portfolio for the future would be the wise move.