As investors, we need to understand how our companies truly make their money. And there's a neat trick developed for just that purpose. It's called the Dupont Formula.
By using the Dupont formula, you can get a better grasp on exactly where your company is producing its profit and where it might have a competitive advantage. Named after the company where it was pioneered, the Dupont formula breaks down return on equity into three components.
Return on Equity = Net margins x Asset Turnover x Leverage ratio
High net margins show that a company is able to get customers to pay more for its products. Think luxury goods companies. High asset turnover indicates that a company needs to invest less of its capital, since it uses its assets more efficiently to generate sales. Think service industries, which often do not have high capital investments. Finally, the leverage ratio shows how much the company is relying on debt to create profit.
Generally, the higher these numbers, the better. Of course, too much debt can sink a company, so beware of companies with very high leverage ratios.
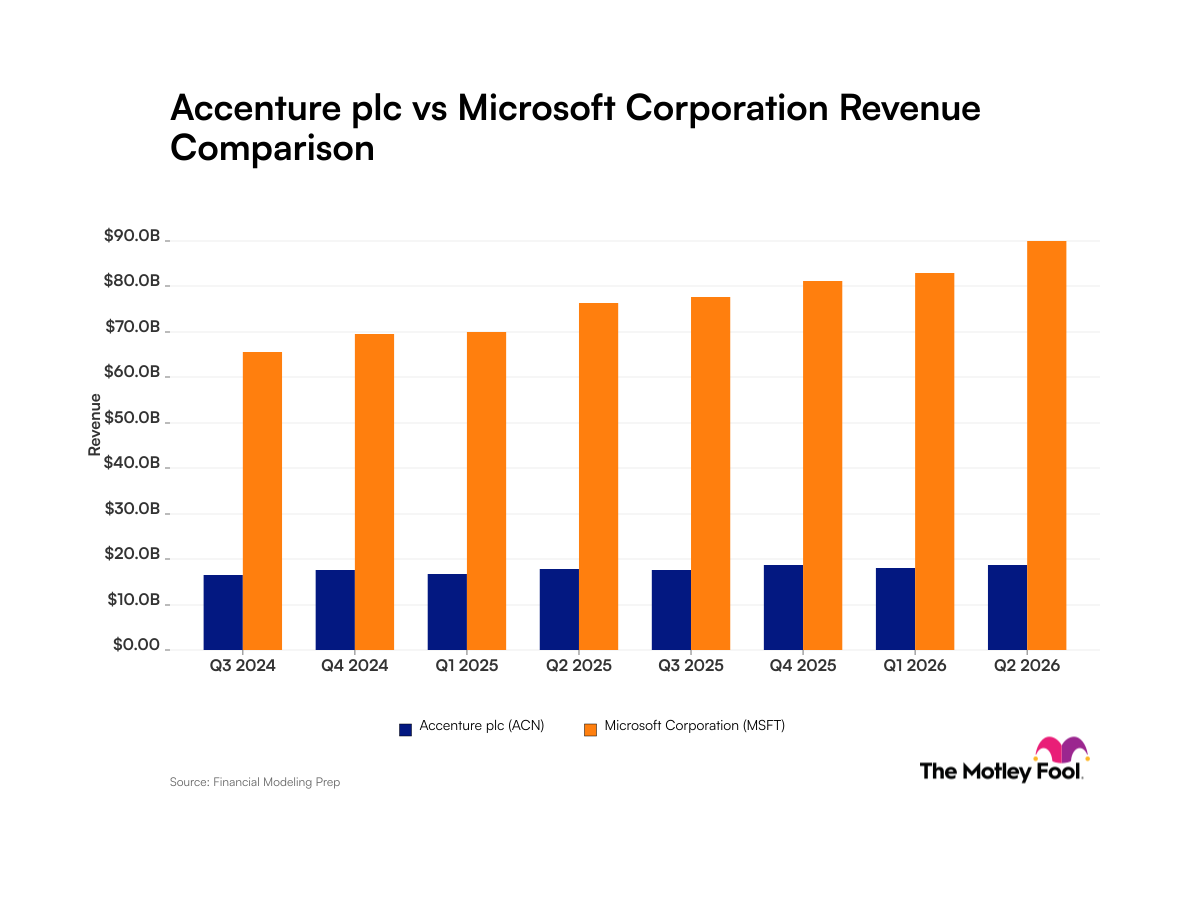
Let's take a look at Microsoft (Nasdaq: MSFT) and a few of its sector and industry peers.
|
Company |
Return on Equity (ROE) |
Net Margins |
Asset Turnover |
Leverage Ratio |
|---|---|---|---|---|
|
Microsoft |
46.7% |
31.3% |
0.76 |
1.96 |
|
Oracle (Nasdaq: ORCL) |
21.8% |
21.7% |
0.50 |
2.03 |
|
Apple (Nasdaq: AAPL) |
35.3% |
21.5% |
1.06 |
1.54 |
|
Google (Nasdaq: GOOG) |
20.6% |
28.8% |
0.61 |
1.18 |
Source: Capital IQ, a division of Standard & Poor's.
Microsoft generates the highest return on equity of this bunch, in part by focusing on high margins and relying on more leverage than some its rivals. Contrast that performance with how Oracle and Apple create their returns. Oracle's margins and asset turnover are lower, but it makes up for this by having higher leverage. Apple has similar margins as Oracle, but increases ROE by relying on higher asset turnover, making its assets more productive. Google's strength is in its high margins, since asset turnover and its leverage ratio are fairly low. If Google were to increase its leverage, it could likely juice its return on equity.
Breaking down a company's return on equity can often give you some insight into how it's competing against peers and what type of strategy it's using to juice its return on equity.