
Tiffany (TIF +0.00%) is the ultimate in class when it comes to jewelry. As long as high-end consumers are doing OK -- and they're doing more than OK right now primarily due to strong real estate and stock markets -- Tiffany should fare well. The stock is up more than 41% year to date.
Tiffany recently made a move to improve its website. Website upgrades are imperative in today's market, since consumers continue to shop more online. Today we'll take a look at what Tiffany has done online, and then compare important numbers between Tiffany, Blue Nile (NILE +0.00%), and Signet Jewelry (SIG 2.52%) to help determine which of these three jewelry companies is likely to offer the best long-term investment opportunity.
Online upgrades
Tiffany has redesigned its website, Tiffany.com, in an effort to generate more traffic and keep those visitors on-site for a longer period of time. This, of course, increases the odds of purchases. Some of Tiffany's key website moves, according to its press release:
- Higher-Resolution Visuals
- Customizable Searches by Category, Designer, Price, and Gemstones
- Enhanced Zoom Capability
- Numerous Views of Jewelry on Models and in Videos
- Improved Showcase of Blue Book
- Expanded Engagement Section
I visited the site and appreciated the easy navigation. There aren't a lot of bells and whistles, but there don't need to be when consumers are searching for high-end jewelry.
Let's see how Tiffany measures up to peers when it comes to online presence.
Online jeweler traffic and engagement
When you think of online jewelers, Blue Nile might come to mind. After all, it operates exclusively online. Therefore, despite Tiffany being a much larger company with a market cap of $10.20 billion versus $519 million for Blue Nile, Blue Nile should have a significant online presence. Below are traffic rankings and visitor engagement numbers for Tiffany.com, BlueNile.com, and SignetJewelers.com based on Alexa.com (a global online analytics provider):
Tiffany.com
- Global Traffic Rank: No. 10,956
- Bounce Rate: 26.80%
- Pageviews per Visitor: 5.61
- Time on Site Average: 4:26
Bounce rate pertains to the percentage of visitors who view one page and leave. The lower the bounce rate, the better. The bounce rate for Tiffany.com is low, indicating that either the site is good at keeping visitors interested, or that visitors visit with the intention of making a purchase. Either way, it's good news. Pageviews per Visitor is also high, and Time on Site is above average.
BlueNile.com
- Global Traffic Rank: 11,167
- Bounce Rate: 37.80%
- Pageviews per Visitor: 4.11
- Time on Site Average: 4:14
Blue Nile isn't far behind Tiffany for global exposure, but the Bounce Rate is higher, and visitors are less interested in hanging around -- but not by a lot.
SignetJewelers.com
- Global Traffic Rank: 512,361
- Bounce Rate: 38.80%
- Pageviews per Visitor: 2.90
- Time on Site Average: 2:26
Signet Jewelers' online presence is weak, and those who visit don't stay around very long. This is a big negative considering so many consumers are now looking to shop online. Signet Jewelers might catch up, but its peers have enormous head starts.
Offline comparisons
Before considering the following comparisons, keep in mind that savvy investors seek long-term investments in well-established companies that pay dividends. Balance can also play a big role when companies are being compared to peers.
Let's first take a look at top-line performance comparisons for these three companies over the past five years:
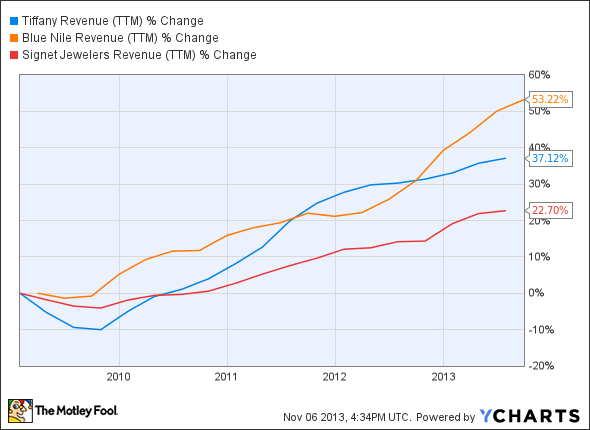
TIF Revenue (TTM) data by YCharts.
Blue Nile is growing the fastest, but all three companies are heading in the right direction.
Bottom line:

TIF EPS Diluted (TTM) data by YCharts.
Signet Jewelers has been growing the fastest on the bottom line, but Blue Nile is well behind (despite recent improvement). Getting back to that point about balance, notice how Tiffany is consistent on both the top and bottom lines.
Now let's take a look at some key metric comparisons:
| Company |
Forward P/E |
Profit Margin |
Dividend Yield |
Debt-to-Equity Ratio |
|---|---|---|---|---|
|
Tiffany |
19 |
11.08% |
1.70% |
0.35 |
|
Blue Nile |
39 |
2.47% |
N/A |
0.03 |
|
Signet Jewelers |
14 |
8.58% |
0.80% |
0.00 |
Source: Company financial statements.
All three companies have displayed excellent debt management, so that doesn't play a role. What stands out is that Tiffany is the best at turning revenue into profit while also offering the highest yield, all at a fair valuation.
The bottom line
Tiffany has been rewarding its shareholders for decades. That's likely to continue. There's little doubt that Tiffany will continue to improve its online presence in order to remain best of breed. The only potential negative is that Tiffany lacks resiliency to bear markets due to its reliance on consumers' discretionary income. However, in these situations,Tiffany should eventually bounce back. It always has in the past.


