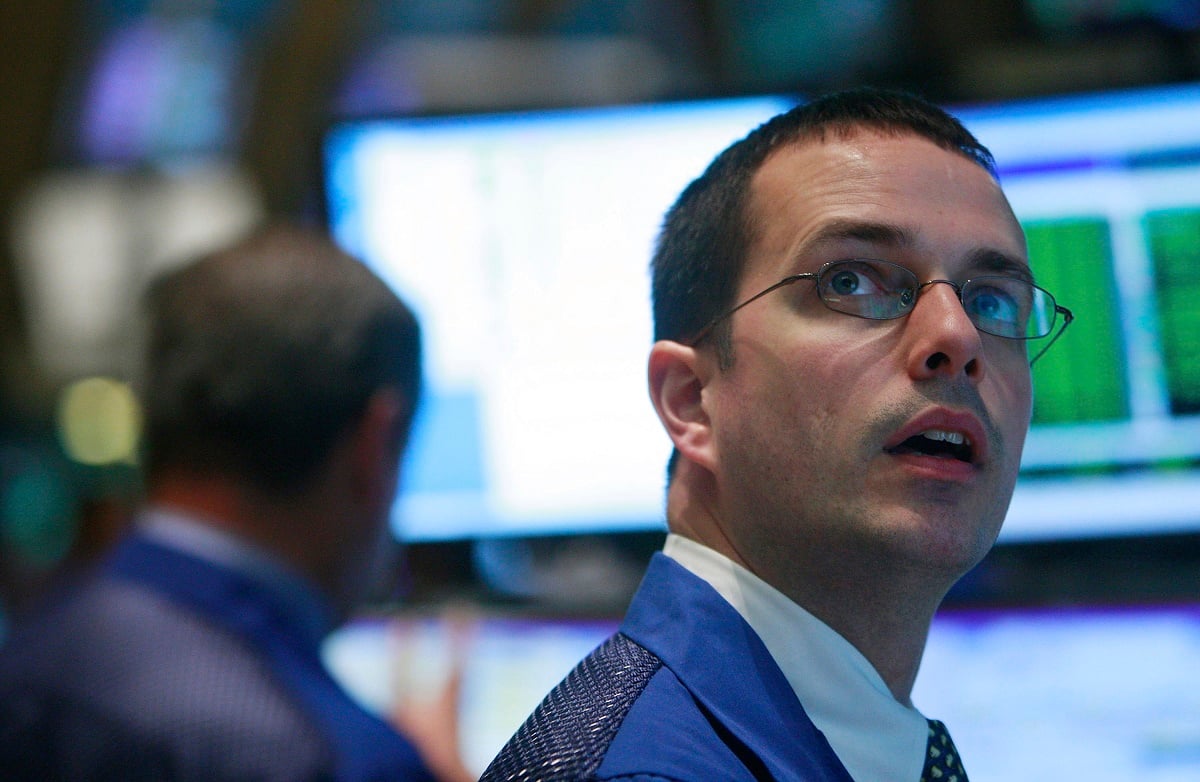
Happy 5th birthday, Mr. Bull Market -- it seems like only yesterday that you sprang from the loins of a dying Bear. Yet, on March 9, 2009, the S&P 500 (^GSPC +0.70%) put in its crisis low of 676.53. Investors had given up on stocks in an environment in which they were being bombarded with seemingly catastrophic headlines on a daily basis.
Seven days earlier, troubled insurer AIG had reported a $61.7 billion loss for the fourth quarter of 2008 -- the largest loss in U.S. corporate history. Two days after that, General Motors disclosed to its shareholders in its annual report that "there is substantial doubt as to our ability to continue as a going concern" (the company was ultimately restructured under bankruptcy protection.) On March 9, the CBOE Volatility Index (^VIX +0.06%), or VIX, which is sometimes referred to as Wall Street's "fear index," closed at 49.68 -- it has not closed above that since then.

What did we know then?
Instead of imminent doom, however, investors might have anticipated that, barring outright economic collapse, there was a decent chance that stocks would perform reasonably well over the next five years (though the market's actual performance has exceeded what one could have hoped for).
Why?
Valuations. On March 9, the S&P 500's cyclically adjusted price-to-earnings ratio, or CAPE, stood at just 11.9 -- cheaper than it had been at any point since 1986 (the cyclically adjusted price-to-earnings ratio, a metric popularized by Nobel laureate Robert Shiller, compares stock prices to an average of inflation-adjusted earnings per share over a trailing-10-year period).
And so it was that the fear and revulsion that brought low risky assets in general, and equities in particular, set the foundations for a stunning bull market:

For the S&P 500 (blue line), which now boasts a 178% price return, a triple is almost in sight, if not immediately within reach. Note that the broad market, as represented by the Wilshire 5000 index (orange line) has done even better, thanks to the huge outperformance of small-capitalization stocks; the Russell 2000 (red line) has well more than tripled over the past five years. (Although the S&P 500 is the most widely used measure of the market's performance, it's technically a large-capitalization index.)
Where do we go now?
But where do those gains leave valuations today and what does that augur for returns over the next five years?
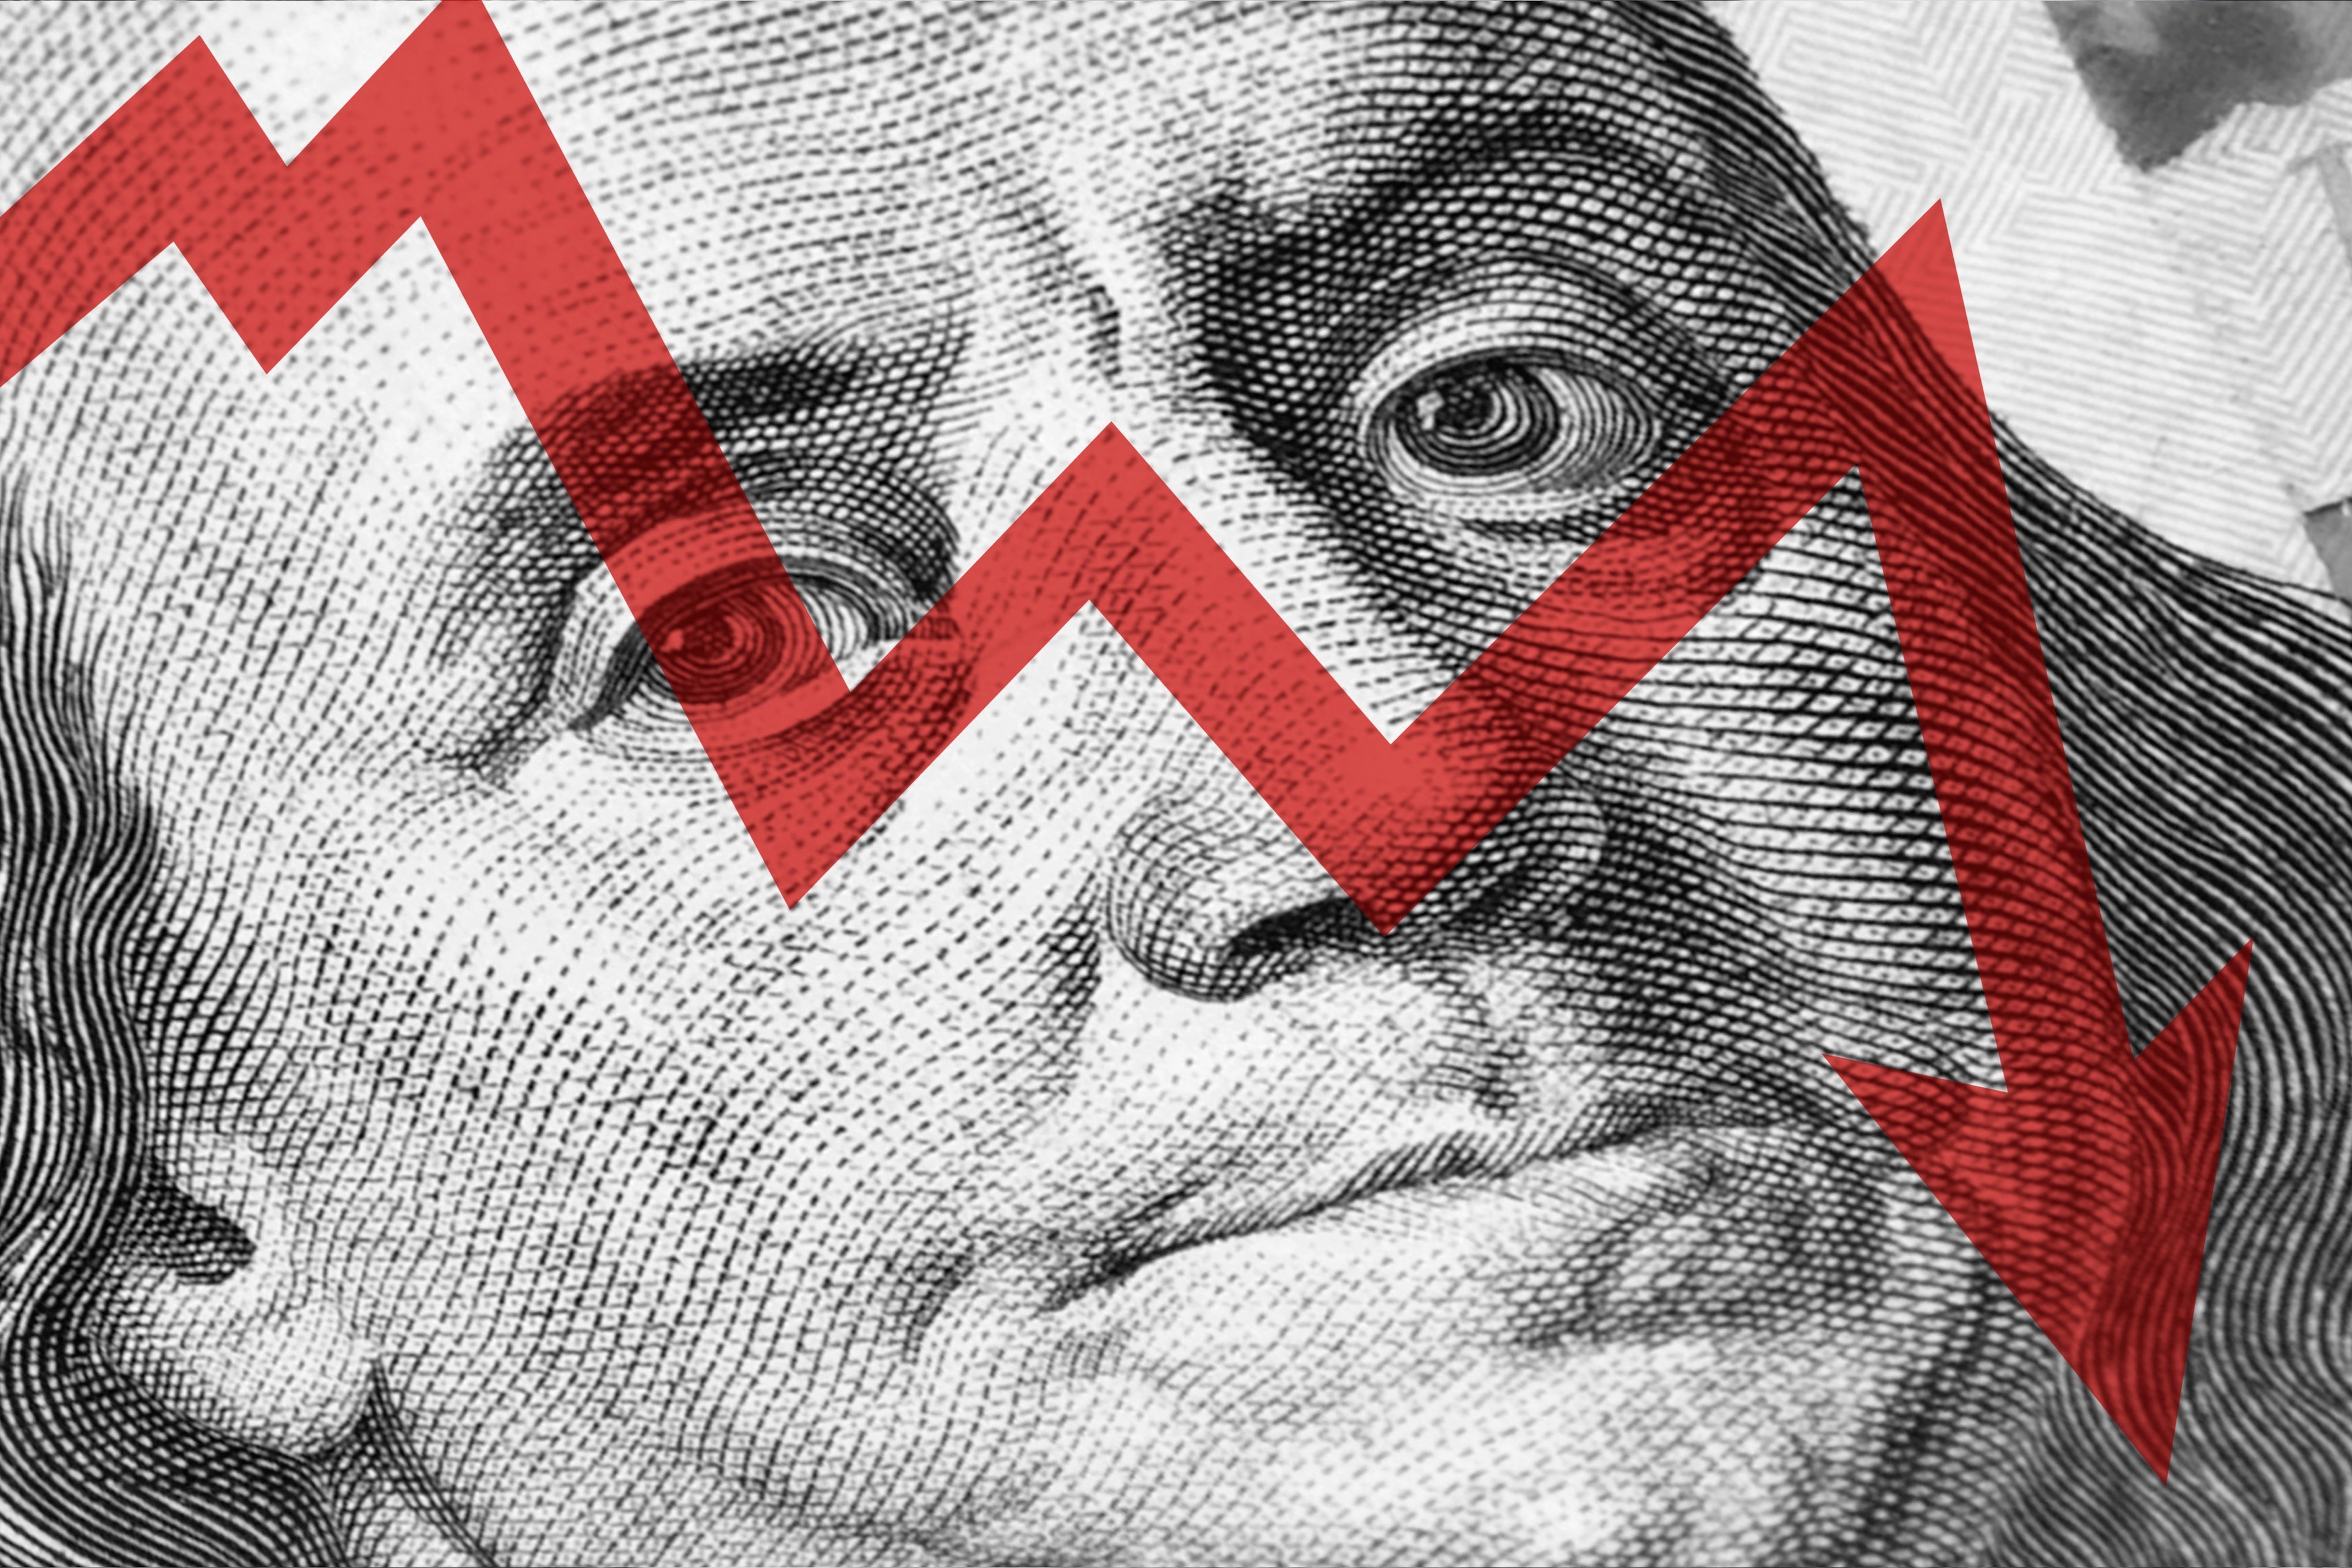
As of Friday's close, the S&P 500 now sports a corpulent CAPE of 25.6, going from a 27% discount to its long-term historical average five years ago, to its current 55% premium. That puts the CAPE into the highest 10% of its values over its entire history going back to 1881.
As hedge fund manager Cliff Asness observed in a November 2012 paper, historically, when the CAPE is within the top decile of its values, subsequent stock market returns are mediocre, with a 10-year real return that has averaged just 0.5% on an annualized basis (it's important to note, however, that the range of returns is very wide, varying from (6.3%) to +6.1%).
Last month, another well-regarded value investor, James Montier of GMO, published a white paper describing two methods to forecast real returns over the next seven years based on the CAPE. The more optimistic estimate called for an annualized return of just +0.8%, while the more pessimistic produced a (3.2%) loss! Those ought to be sobering figures, particularly for individual investors who have only now begun to drink directly from the equity market punchbowl.
With the prospect of such mediocre returns, should investors be selling their stocks instead of buying? My answer is "no." As my Foolish colleague Morgan Housel has highlighted, the CAPE isn't perfect (though I would argue it's the best metric we have) and even with a high starting CAPE value, the range of outcomes in terms of performance is very wide. As Cliff Asness points out:
I would, if trading on a tactical outlook, give the Shiller P/E some small weight, particularly when it's above 30 or below 10. But I think this type of analysis is most useful not for a trading strategy but to set reasonable expectations.
If you are a "know-nothing" investor (there is no shame in this -- it's the path almost every investor should adopt), the lesson is to temper one's expectations for future stock market returns -- the next five years are unlikely to mirror the past five and they could end up being very disappointing relative to stocks' historical average return (roughly 6.5% per annum, after inflation). Still, if you have an equity-appropriate time horizon, you can continue to put money into a low-cost index fund at regular intervals.
2 values in a heated market
If you have some skill, experience, and time -- and the inclination to pick individual stocks -- know that it's becoming increasingly difficult to ferret out names that trade at a discount to (or even at) their intrinsic value. However, there are still some values out there. Take the insurance sector, for example: MetLife (MET -0.97%), the No. 1 publicly traded life insurer in the U.S., is a wonderful franchise, yet it is valued at less than 9.5 times the next 12 months' earnings-per-share estimate -- a significant discount to the overall market. Viewed from another angle, it does not take much in the way of returns on equity to justify the stock's 21% premium to its tangible book value.
Another insurance-related name, Berkshire Hathaway (NYSE: BRK-B), looks reasonably priced. In his recently released annual letter to shareholders, CEO Warren Buffett wrote that stock repurchases at 120% of book value "benefit continuing shareholders because per-share intrinsic value exceeds that percentage of book value by a meaningful amount." On Friday, Berkshire's shares closed at 136% of book value. My sense is that when Buffett refers to a "meaningful amount," it's more than the difference by which 136 exceeds 120.
When it comes to individual stocks or the broad market, valuation has predictive value with regard to future performance. Right now, the U.S. stock market doesn't look particularly cheap, and while that tells us nothing about the market's direction in the near term, it's an anchor on performance over the medium to long term. Just as investors who extrapolated bear market losses into the future five years ago were wrong, those who extrapolate similar gains to those achieved over the past five years could well be making the same mistake today.