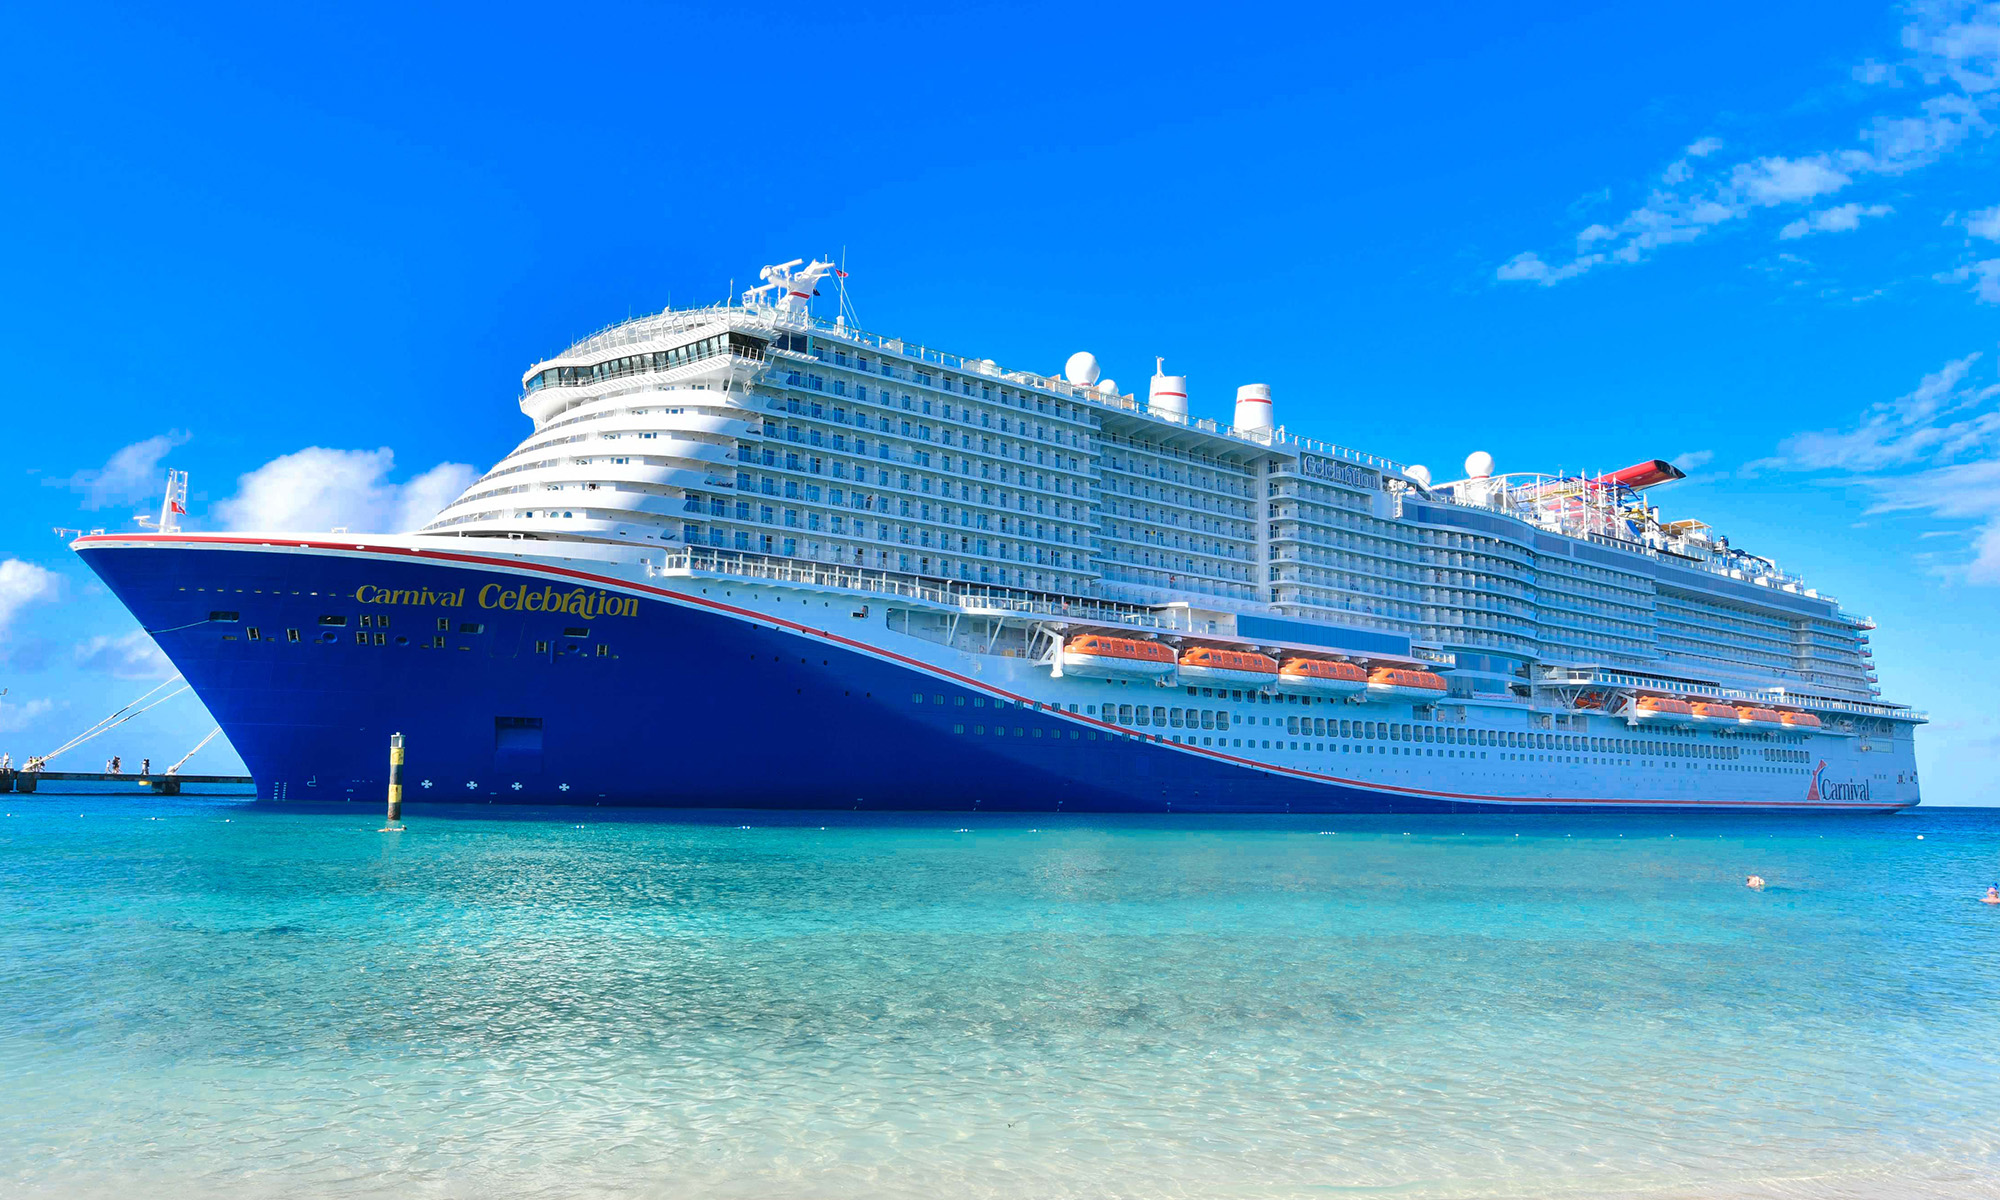
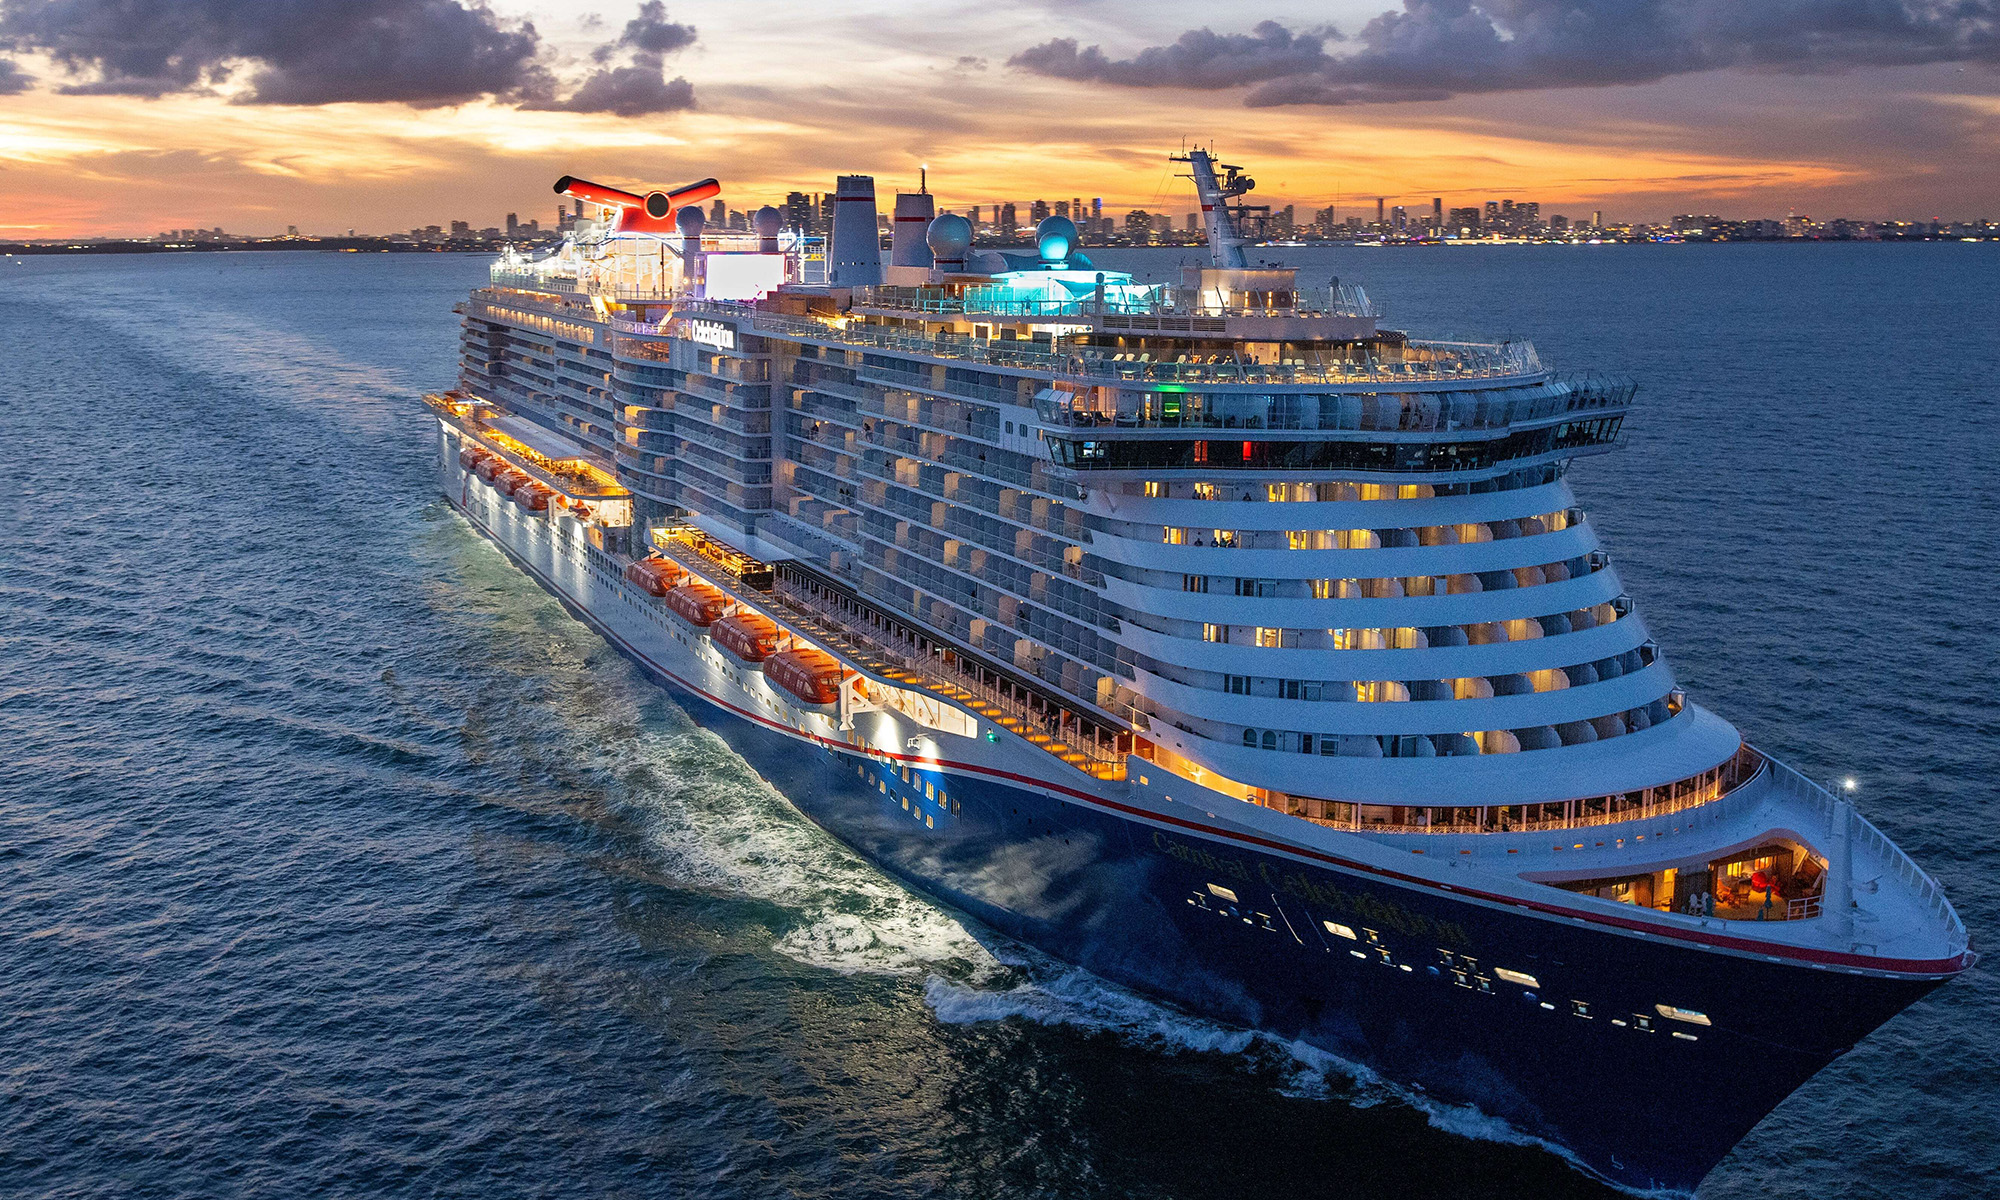
While Carnival Corporation's (NYSE : CCL) ships sail the high seas, the company's financial results have set an anchor. Revenue has stagnated while costs have risen. Profitability ratios show that the company is performing worse from recent years. Can management steer the company back to smooth sailing?
Stagnated revenue
Total revenue is categorized into passenger tickets, on-board sales, and tours; which represent approximately 75%, 23% and 2% respectively. Since 2011 sales of passenger tickets have decreased 4.2% while on-board sales have increased 7.2%. Apparently the duty-free alcohol and cigarettes is too good a deal to pass up for any booze cruisers. All jokes aside, total revenue grew .5% YOY, and decreased 2.1% since 2011.
Rising costs
Poor sales have been exasperated by rising costs. Payroll and SG&A increased 6.7% and 9.2%. Advertising expenses are partly responsible for SG&A, as it increased from $527 million to $588 million in the past fiscal year. Other ship operating expenses, accounting for 17% of sales, increased 15.9% since last year.The majority of other operating expenses come from repairs and maintenance expenses, which have increased from $832 million to $954 million in the past year. These cost are apart of Carnival's "capital program," which is focused on enhancing efficiency of the ships. The maintenance expenses will likely not increase much further in upcoming years, and will only rise as Carnival increases it's fleet. The positive side is that these expenditures will likely increase the time that ships are available for use. It may be helpful to understand how the current maintenance cost will affect depreciation in future years.
Profitability
The compression of sales and increase in expenses is not a good sign. Foolish investors understand when operational expenses grow while the revenue is growing, but that is not the case. In fact, the company had abysmal operating income, decreasing 17% YOY, and 40% from 2011. The bottom line did not fare much better than operating income, as it decreased $220 million, or 17% YOY. Since 2011, net income decreased $834 million, or 43.6%. The disconcerting part about the bottom line decline is that the company pays virtually no income tax since it enjoys the Panama tax holiday. The table below describes the profitability ratios for Carnival.
|
Profitability ratios | |||
|---|---|---|---|
|
2011 |
2012 |
2013 | |
|
Return on assets |
4.95% |
3.31% |
2.69% |
|
Return on equity |
8.02% |
5.42% |
4.39% |
|
Operating profit margin |
14.28% |
10.67% |
8.75% |
|
Net profit margin |
12.11% |
8.44% |
6.97% |
All of the ratios have shown sizable negative downtrends. The poor ratios are yet another signal of costs increasing faster than revenue. Comparing Carnival's 2013 results to Royal Caribbean (NYSE : RCL), the profitability ratios show similarity.
|
2013 Ratios |
Royal Caribbean |
Carnival |
|---|---|---|
|
Return on assets |
2.68% |
2.69% |
|
Return on equity |
5.54% |
4.39% |
|
Operating profit margin |
10.74% |
8.75% |
|
Net profit margin |
5.95% |
6.97% |
Carnival's net profit margin is about a percentage point higher, even though its operating profit margin is 2% less. These comparisons show that Carnival is not fully responsible for the poor results, since it's top competitor is also experiencing unsettled sea's. With that said, if revenue remains stagnant or decreases, it is imperative that Carnival cuts its operating expenses.
Foolish Conclusion
Carnival's profitability downtrend illuminates problems that the Foolish investor cannot ignore. If the company is unable to spur revenue growth, it will have to cut costs to provide investors with a reasonable return on equity. Continuation of recent results will force investors to jump ship.


