Markets are heading higher today, but only one of America's two most-watched indexes is pushing toward uncharted territory. The Dow Jones Industrial Average (^DJI +0.63%) at lunchtime remained more than 100 points below the all-time high close of 16,715 points it reached on May 13, but the S&P 500 (^GSPC +0.55%) was closing in on 1,900 points for the first time ever.

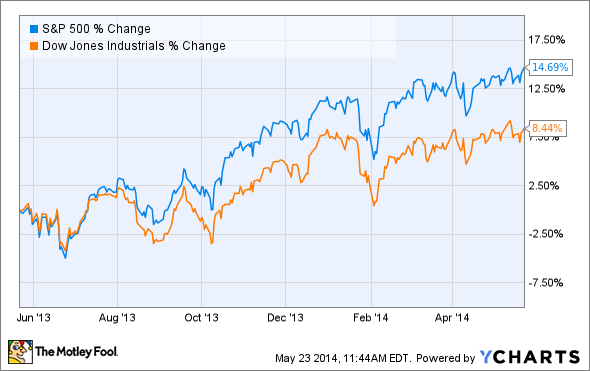
The S&P has gained 5% more than the Dow over the past decade. Much of that outperformance came in the past year, when the broader index surged nearly 15% compared to a more modest 8.5% gain in its blue-chip counterpart.
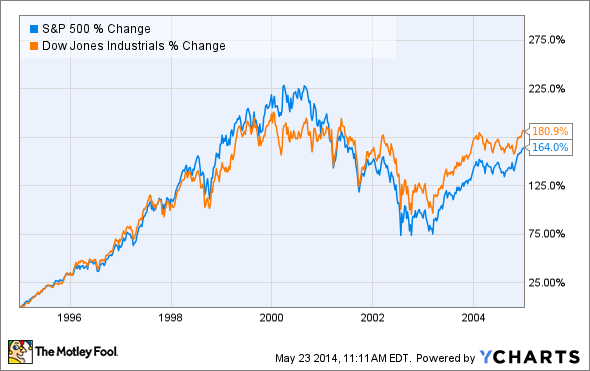
This outperformance vanishes on earlier timelines, as the Dow actually held up better than the more-diverse S&P 500 in the aftermath of the dot-com bubble.
There's an easy explanation for this discrepancy, as the fortunes of both indices have depended in different degrees on the fortunes of the tech industry. The S&P currently boasts 70 "technology" companies, according to Finviz, while six of the Dow's 30 components are in the tech sector. The Dow should weight its tech companies more heavily, but that's not the case, as its price-weighting scheme penalizes the lower-priced shares of most of its tech components, resulting in a rather weak 13.9% weighting.
The S&P's 70 tech companies, on the other hand, are weighted by the size of their market cap, and that gives them a larger share of the pie, with a total weighting of 17.5%. Finviz actually underrepresents the tech industry in its categorization, since Apple (AAPL +0.24%) is counted as a consumer goods company despite clearly being part of the Silicon Valley elite. Adding four of the larger tech companies miscategorized in Finviz boosts the industry's weight on the S&P to 22%, which is nearly twice that sector's weighting on the Dow. While only one tech component -- IBM (IBM 0.97%) -- is among the Dow's five most heavily weighted, the S&P has eight tech companies ranked among its 20 largest, and those eight components alone account for 12.25% of the S&P's total weight.

Apple was the S&P's heavy-hitter until its peak in 2012, but Facebook (FB +5.66%) has taken the lead as index superstar over the past year. Its current weighting of roughly 0.9% means that its 143% rise during that period has been worth over 1% in gains for the S&P, more than offsetting the weakness in IBM shares. IBM accounts for roughly 1.1% of the S&P's daily movements, but over 7% of the Dow's. Since IBM is the only one of the S&P's biggest tech components to underperform the index itself over the past year, it's easy to see why the Dow has underperformed relative to its more diverse counterpart. Relying too heavily on a few high-priced megacaps has left it vulnerable to a single company's weaknesses in ways the S&P is not.
If the Dow dawdles while the S&P cracks 1,900 points and keeps pushing higher, it may very well be because one index tracks a broader range of large-cap outperformers in a hot sector, while the other relies on the few weak spots in that sector for much of its momentum.