Wendy's (WEN -3.01%) shares have gained over 37% in the past year, as the chain struck upon a hit sandwich that boosted comps past McDonald's (MCD -0.16%) and Burger King (BKW +0.00%). Wendy's has prioritized attracting the younger Millenials audience through its advertising overhaul and a refreshed menu.
But, is the company's dedication to limited-time menu items threatening gains?

Source: Wendy's
Revenue down on year, comps down on quarter
Wendy's recent first-quarter results beat analyst estimates with revenue of $523 million and $0.07 EPS, which marked the first revenue beat in five quarters. But, revenue was still down 13% year over year, and comps weakened from the latter half of 2013.
I previously mentioned that, due to McDonald's sheer size, comparable store sales are the best way to compare the performance of the three major fast-food chains. Wendy's was turning in impressive numbers late last year, but softened in the first quarter.
|
|
1Q13 |
2Q13 |
3Q13 |
4Q13 |
1Q14 |
|---|---|---|---|---|---|
|
Wendy's |
0.8% |
0.4% |
3.2% |
3% |
1% |
|
Burger King |
(1.4%) |
0.6% |
0.9% |
1.7% |
2% |
|
McDonald's |
(1%) |
1% |
0.9% |
(0.1%) |
0.5% |
Source: Company filings. Wendy's comps represent the average of company-owned and franchise-owned comps. Burger King and McDonald's comps represent their global performance.
The quarter-on-quarter comps drop isn't a red flag quite yet, despite the fact that the other two chains increased in the previous quarter. But, if the trend continues, it will prove that Wendy's took a risky road when it shoved off the wildly popular Pretzel Bacon Cheeseburger and Pretzel Pub Chicken in favor of new, limited-time sandwich attempts.
But, comps isn't the only metric investors should watch.
Taking a look at margins
Gross profit margin matters because it represents how much money is left over after subtracting the cost of goods sold, or COGS, and those leftovers can drip down into net income. And the margin allows for easy comparison between competitors in the same industry. But it doesn't quite work that way for fast food companies. More on why in a second.
Let's take a look at what an investor would see when glancing
So, how has Wendy's performed against its competition over the two years leading up to the most recent quarter?
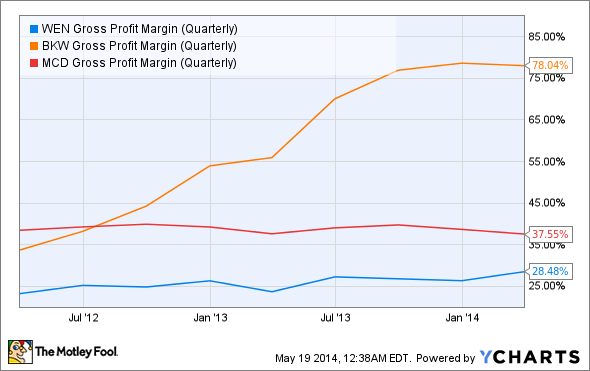
WEN Gross Profit Margin (Quarterly) data by YCharts
And to go the extra mile, let's look at the two metrics that go into calculating gross profit margin: cost of goods sold, or COGS, and revenue. Start with Wendy's:

WEN Revenue (Quarterly) data by YCharts
That's not a bad relationship between COGS and revenue, though the trail off at the end isn't fantastic. But, at least Wendy's has the COGS on the bottom, unlike recovering department store J.C. Penney.
But, let's see what that comparison looks like for McDonald's and Burger King.

MCD Revenue (Quarterly) data by YCharts
Now for the devil in the details. The graphs comparing one company's COGS to its own revenues are correct and do tell a story. But comparing the company's to each other in gross profit margin doesn't work as cleanly as it would with, say, department stores.
Franchise effect
The devil's always in the details. Fast food restaurants differ from, say, department stores in that a large number of stores are franchises rather than company-owned. Why does that matter? Because in a franchise situation, the franchise owner takes on some of the COGS responsibilities. And the corporation's franchise revenues come from franchise and royalty fees rather than the typical food and drink sales. So the percentage of franchised stores can alter the metrics behind gross profit margin.
So how franchise-dependent is each chain?
McDonald's number of franchises has grown nearly 13% in the past six years and franchises accounted for 81% of total restaurants at the end of last year. Burger King's franchises make up a whopping 96% of its restaurant fleet, which is up 8% from the franchise rate in 2009. And Wendy's went on a refranchising kick last year to bring its total up to 82%.
Look back at the gross profit margin comparison chart. The fact that McDonald's and Wendy's are running parallel is partly due to having a similar percentage of franchises. Burger King has risen above because it simply doesn't have as much COGS to deal with because its fleet is almost entirely franchised.
Is it still worth it to look at the gross profit margin for each company? Absolutely, but know what information needs to be considered.
Foolish final thoughts
First-quarter results were rather unimpressive for Wendy's. Comps were up year over year, but revenue was down, and comps were down on the previous quarter. Another quarter of losses could further jeopardize Wendy's margins, especially if another limited-time item doesn't reach the popularity of the Pretzel Bacon Burger to boost revenue and comps. Otherwise, the slowdown seen in the first quarter could go back to being Wendy's norm.


