What: Cryogenic and industrial gas-processing equipment manufacturer Chart Industries, (GTLS +0.06%) has seen its stock plummet in recent months. The trend continued, with the company's stock giving up another 27.3% in July:

July's slide was nothing new for Chart investors, who've seen the stock fall almost 80% since September 2013, when it almost reached $130.
So what: The recent slide and the big drop are actually related, more or less. Back in 2013, Chart was heavily hyped as a sure-bet winner in the expansion of natural gas consumption around the world, especially LNG, liquefied natural gas, which can be produced with the equipment that Chart makes. Unfortunately, all that promise hasn't let to the explosive growth that so many people predicted.
While the 2013 peak was definitely a hype bubble, the more recent drop is a product of the scary downturn in China's economy. Chart has invested big bucks there in recent years to increase its manufacturing capacity, but economic weakness has put a further crimp on growth there. The company reduced its guidance for the rest of the year recently, citing weak demand and a very challenging foreign exchange environment that's taking a bite out of results.
Now what: The funny thing is, Chart's valuation is actually pretty attractive right now, having fallen sharply along with the stock price. The company is solidly profitable, and produces plenty of positive cash flows, it's not really in any danger from the slowdown overseas. Actually, management is pretty upbeat on its prospects here in the U.S., as a number of major LNG export projects ramp up.
Sure; business is less than ideal, but Chart is well-run, and has a solid balance sheet. Due to the cyclical nature of demand for its products, now -- while the stock is relatively beaten down -- could actually be a great time to buy.
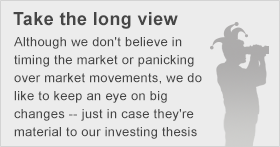
I'm not calling a bottom here -- continued weakness in China and Europe could continue to weigh on the stock in the short term. But for investors with a time frame looking out a few years, Chart looks like a great investment.