Tesla logo

Tesla(NASDAQ) TSLA

Market Cap$1.47TMarket cap calculated using publicly traded shares outstanding only. Does not include unlisted, private, or dual-class non-traded shares. Implied market cap may vary.
Since IPO (2010)+23,271%
5 Year+23%
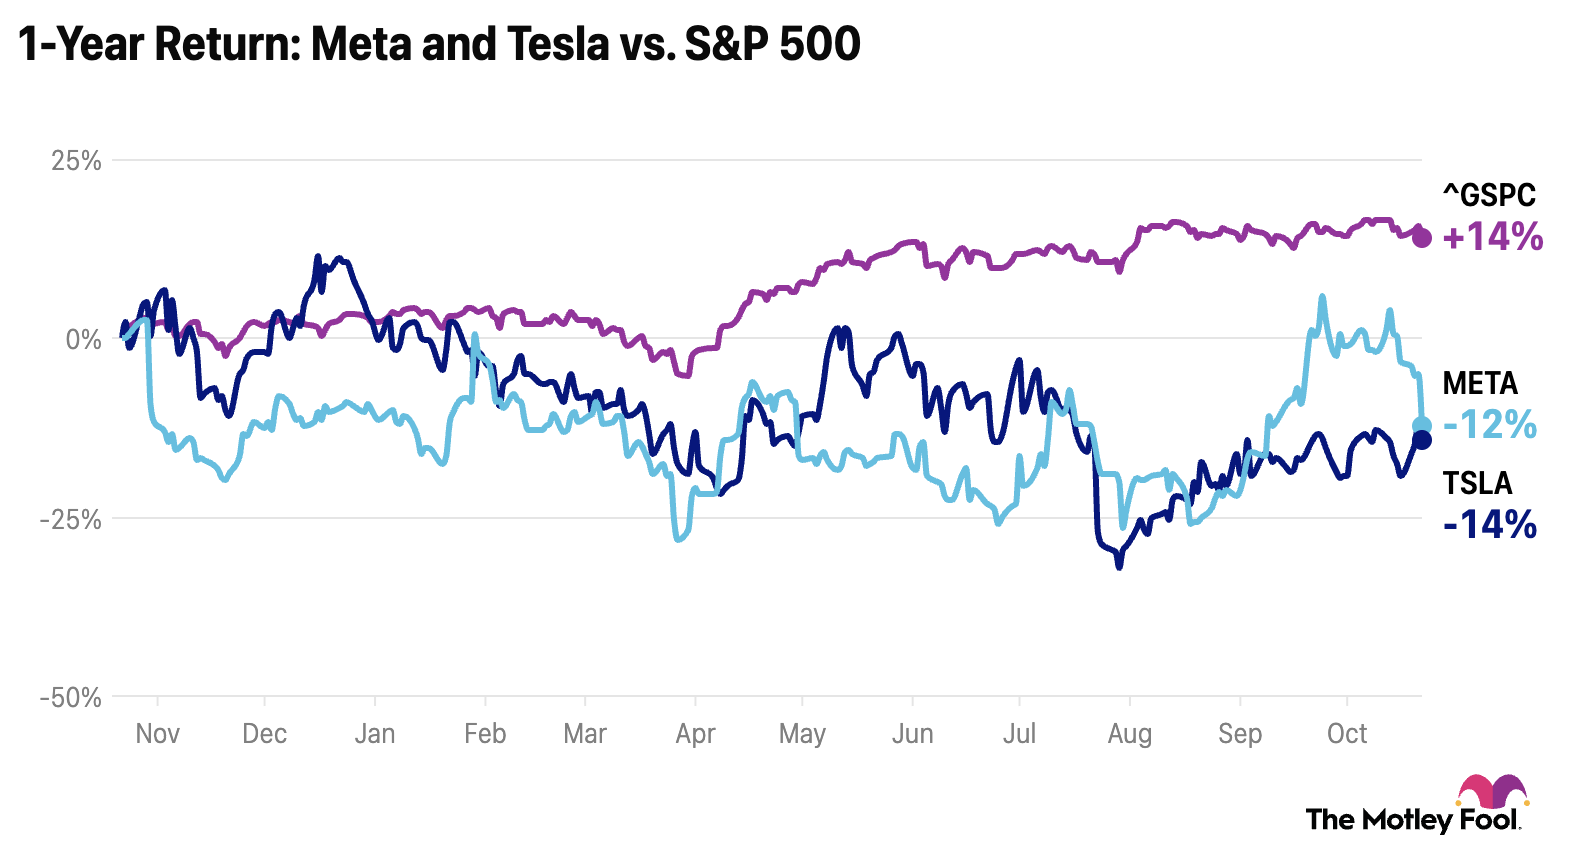
1 Year-17%
1 Month-2%
Premium Feature
Moneyball Superscore
65/100
$372.49
-0.56%
-2.09Today
After hours$371.68-$0.81 (-0.22%)
Tesla last closing stock price
MetricPriceDate
Last closeUSD 372.222026-10-23
Tesla stock price return by period
PeriodPrice returnPrice at period startPeriod start date
1 week+4.93%USD 354.722026-10-16
1 month-2.08%USD 380.122026-09-23
3 month+18.91%USD 313.032026-07-24
Year to date-17.23%USD 449.722025-12-31
1 year-17.1%USD 448.982025-10-23
3 year+71.91%USD 216.522023-10-24
5 year+22.75%USD 303.232021-10-22
Since inception+23,270.88%USD 1.592010-06-29

Tesla Financials at a Glance

Market Cap

$1.47TMarket cap calculated using publicly traded shares outstanding only. Does not include unlisted, private, or dual-class non-traded shares. Implied market cap may vary.

Revenue (TTM)

$103.57B

Net Income (TTM)

$3.22B

EPS (TTM)

$0.91

P/E Ratio

409.44

Dividend

$0.00

Beta (Volatility)

2.07 (High)

Price

$372.49

Volume

34,762,967.915

Open

$373.20

Previous Close

$372.22

Daily Range

$365.27 - $377.32

52-Week Range

$297.38 - $498.83

Estimated Earnings Date

Jan 27, 2027

About Tesla

Tesla NASDAQ:TSLA makes electric cars that people drive every day. It also creates systems to capture and store solar power. The company develops smart software to help its vehicles drive themselves.

What Tesla Makes

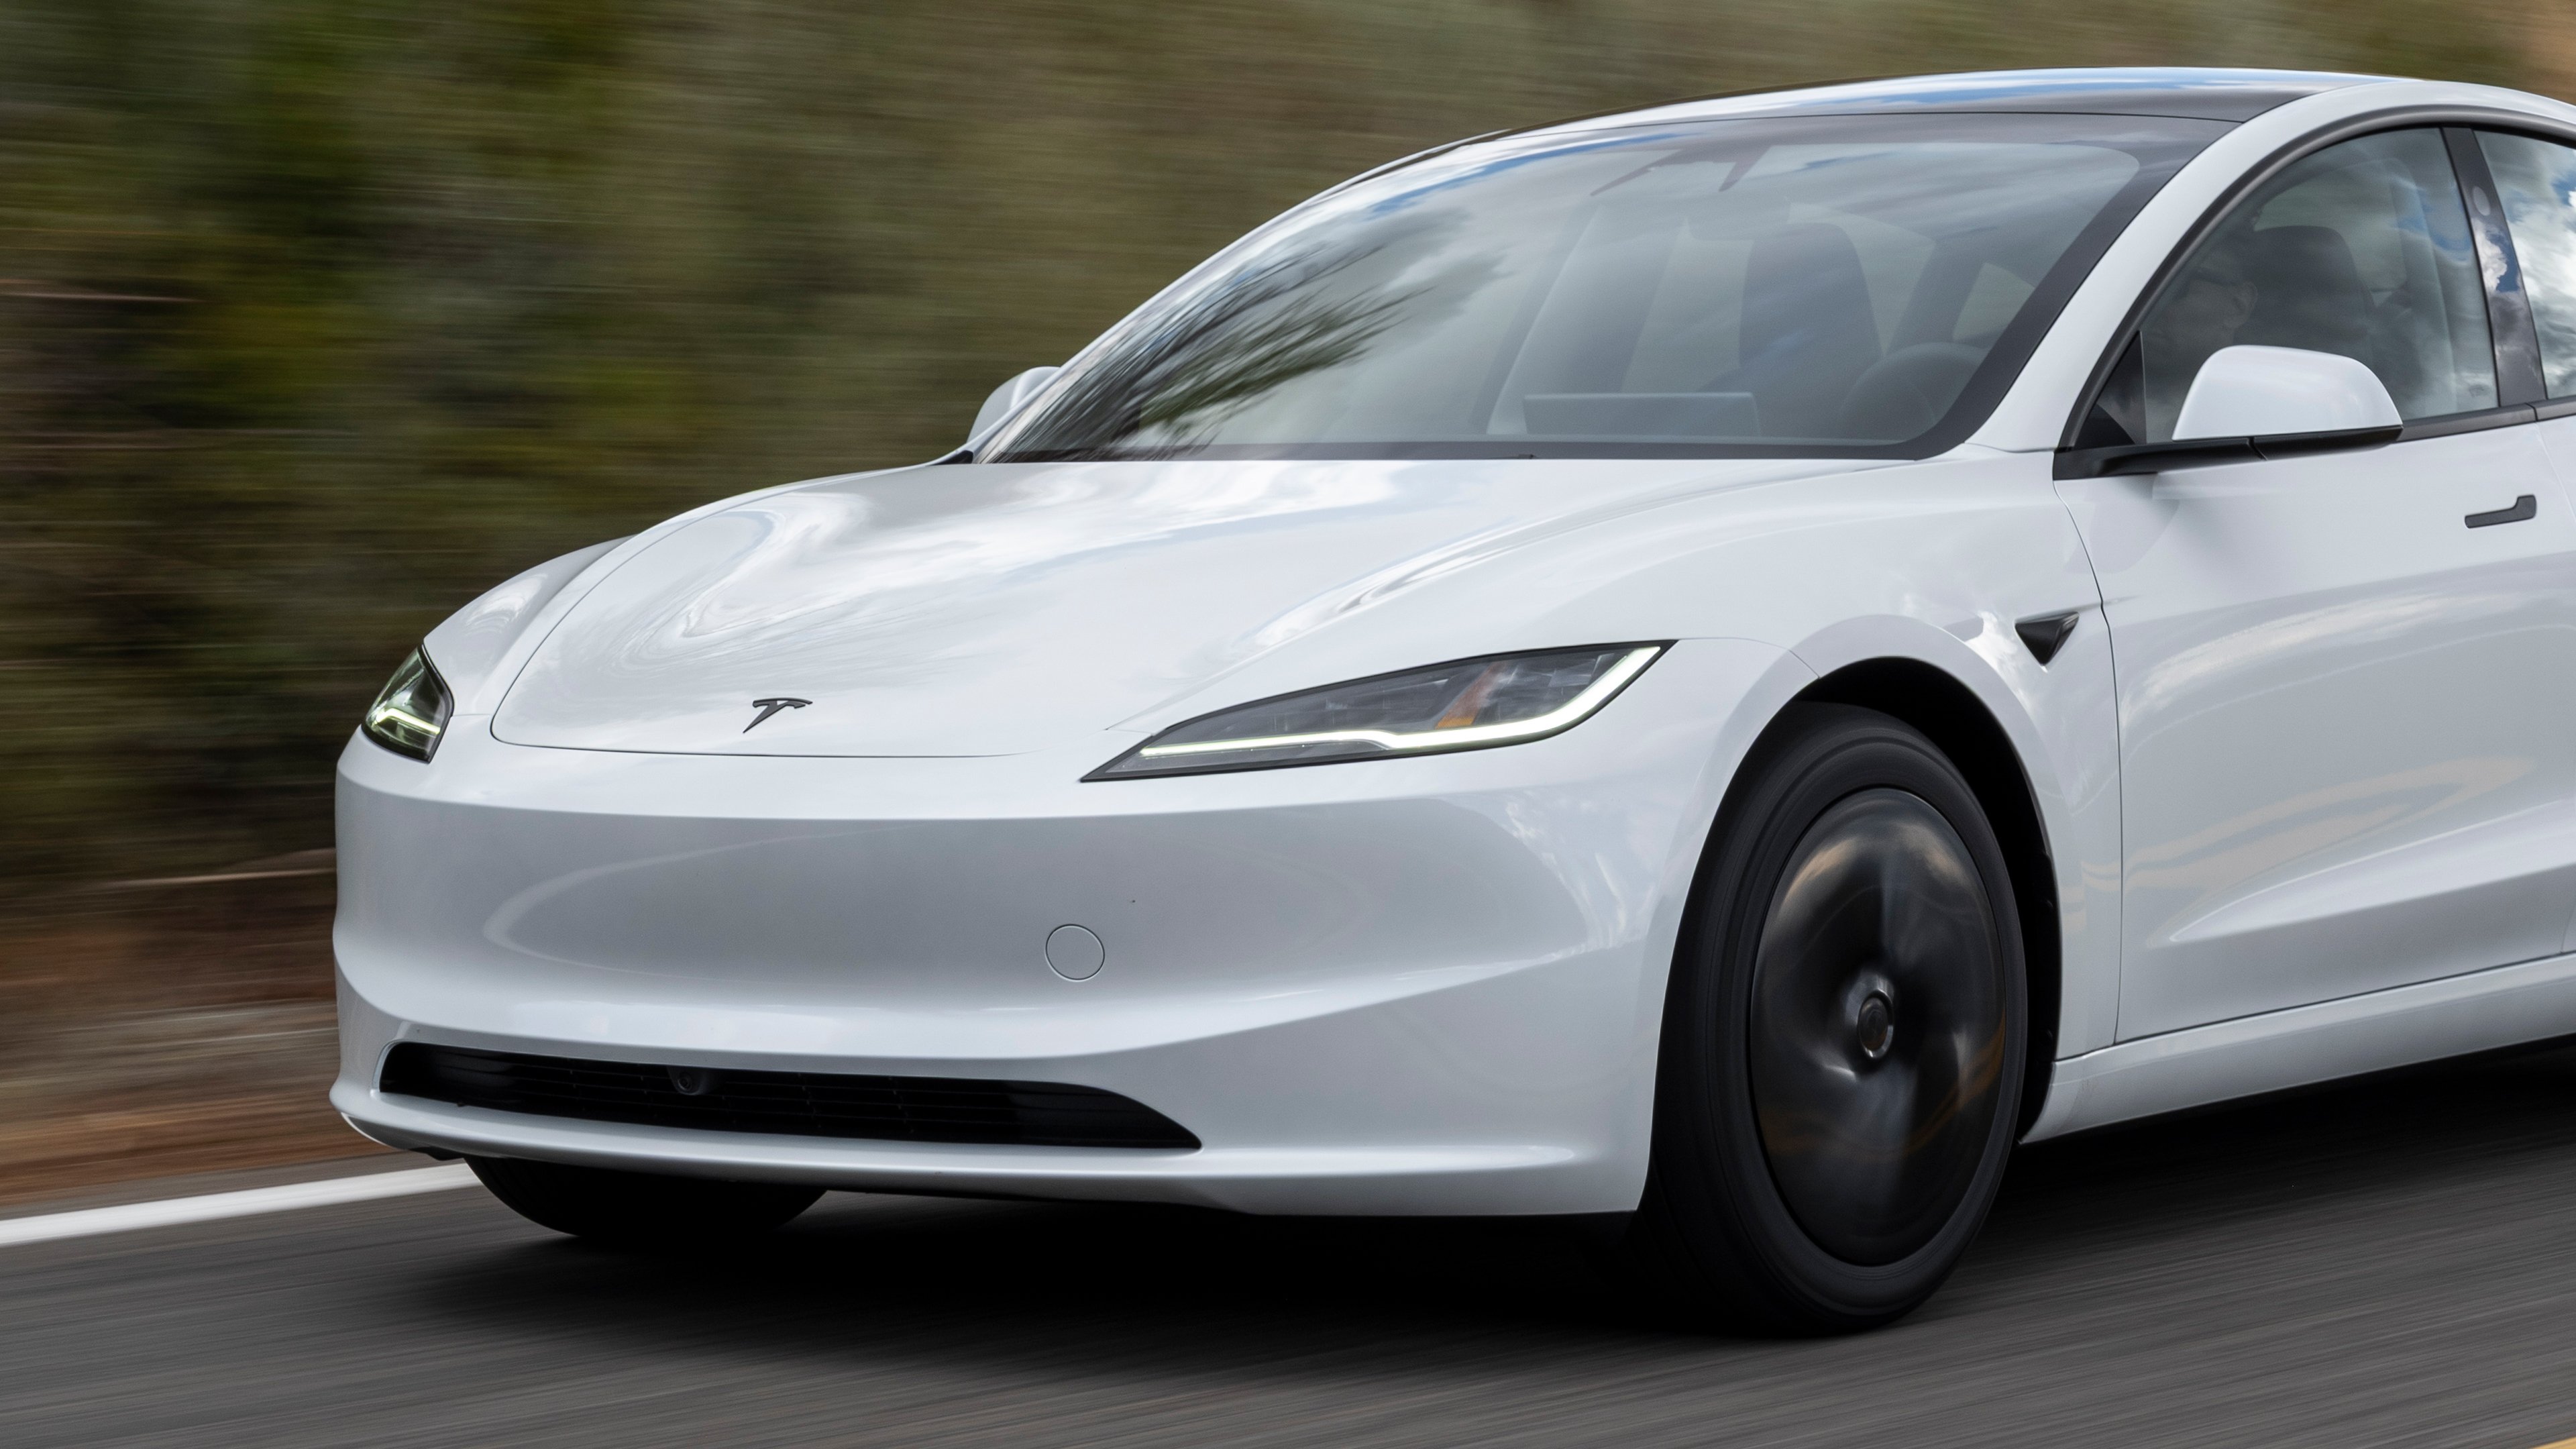
  • Automotive: Includes the design and sale of electric sedans and SUVs, along with revenue from regulatory credits; generated $57.31 billion in revenue during the nine months ended Sept. 30, 2026.
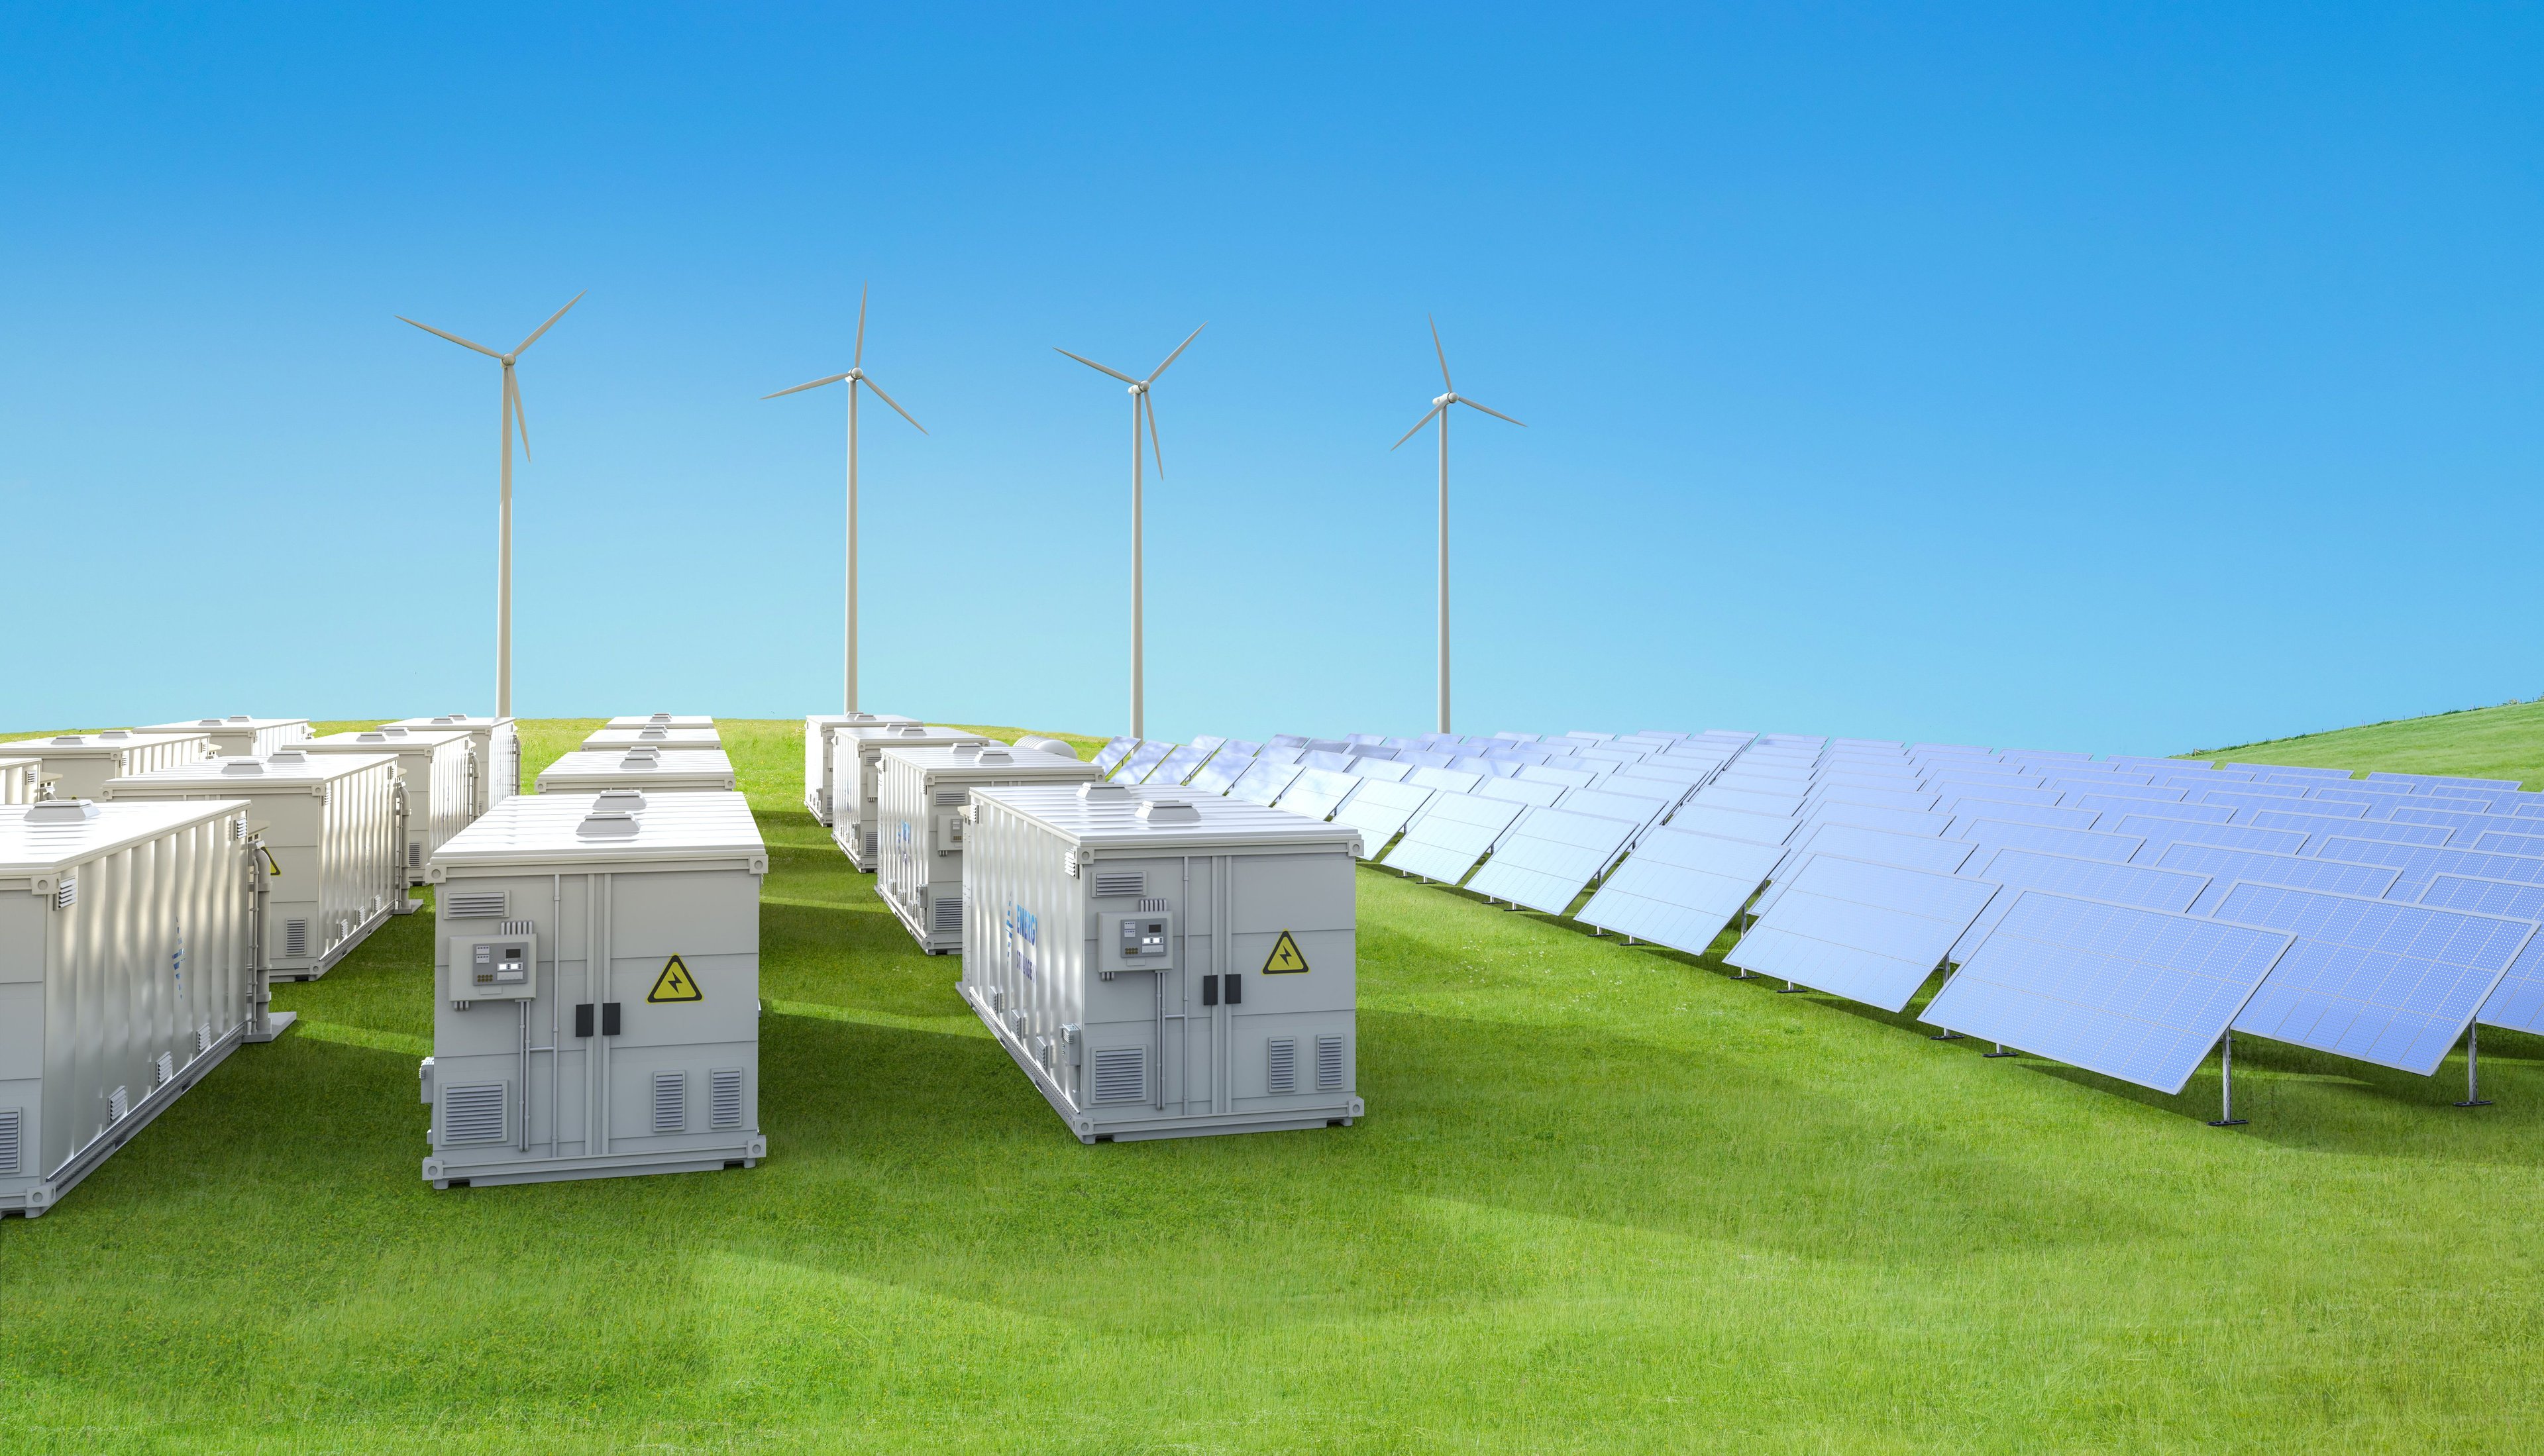
  • Energy Generation and Storage: Provides solar power systems and large-scale batteries for homes and utilities; brought in $8.43 billion in revenue for the nine months ended Sept. 30, 2026.
  • Services and Other: Manages vehicle maintenance, used car sales, and the Supercharger network for fast vehicle charging; accounted for $12.93 billion in revenue for the nine months ended Sept. 30, 2026.
  • Autonomy and Robotics: Develops self-driving software known as Super Intelligence (SI) and the Optimus humanoid robot.

Growing the Business

  • Launched the Robotaxi service in June 2025 to advance a service-driven business model.
  • Introduced the Cybercab and the Tesla Semi during the third quarter of 2026.
  • Invested $2.00 billion in SpaceX common stock during the nine months ended Sept. 30, 2026.
  • Began production at a new battery factory near Houston, Texas, in the third quarter of 2026.
  • Entered into three credit agreements in Sept. 2026 providing $30 billion in funding flexibility.

What Sets Tesla Apart

Tesla focuses on vertical integration by manufacturing its own battery cells and semiconductors at large-scale facilities called Gigafactories. The company uses data from its large fleet of vehicles to improve its Super Intelligence (SI), which refers to advanced computer systems capable of learning and solving complex problems. These operational strengths support a strategy aimed at reducing production costs while leading the transition to sustainable energy.

Tesla by the Numbers

  • Total revenues were $78.67 billion for the nine months ended Sept. 30, 2026, up 13% year over year.
  • Net income attributable to common stockholders reached $2.38 billion during the nine months ended Sept. 30, 2026.
  • Cash provided by operating activities was $14.90 billion during the nine months ended Sept. 30, 2026, up $3.96 billion from the prior-year period.
  • Capital expenditures were $13.01 billion during the nine months ended Sept. 30, 2026, compared to $6.13 billion during the same period in 2025.

Tesla's Evolving Mission

Tesla has moved from a niche car maker to a technology company focused on artificial intelligence and clean energy. Its heavy investment in compute infrastructure and robotics supports a shift toward service-based revenue and autonomous transport.

AI Generated • Oct 22, 2026

Industry

Automobiles

Employees

134,785

CEO

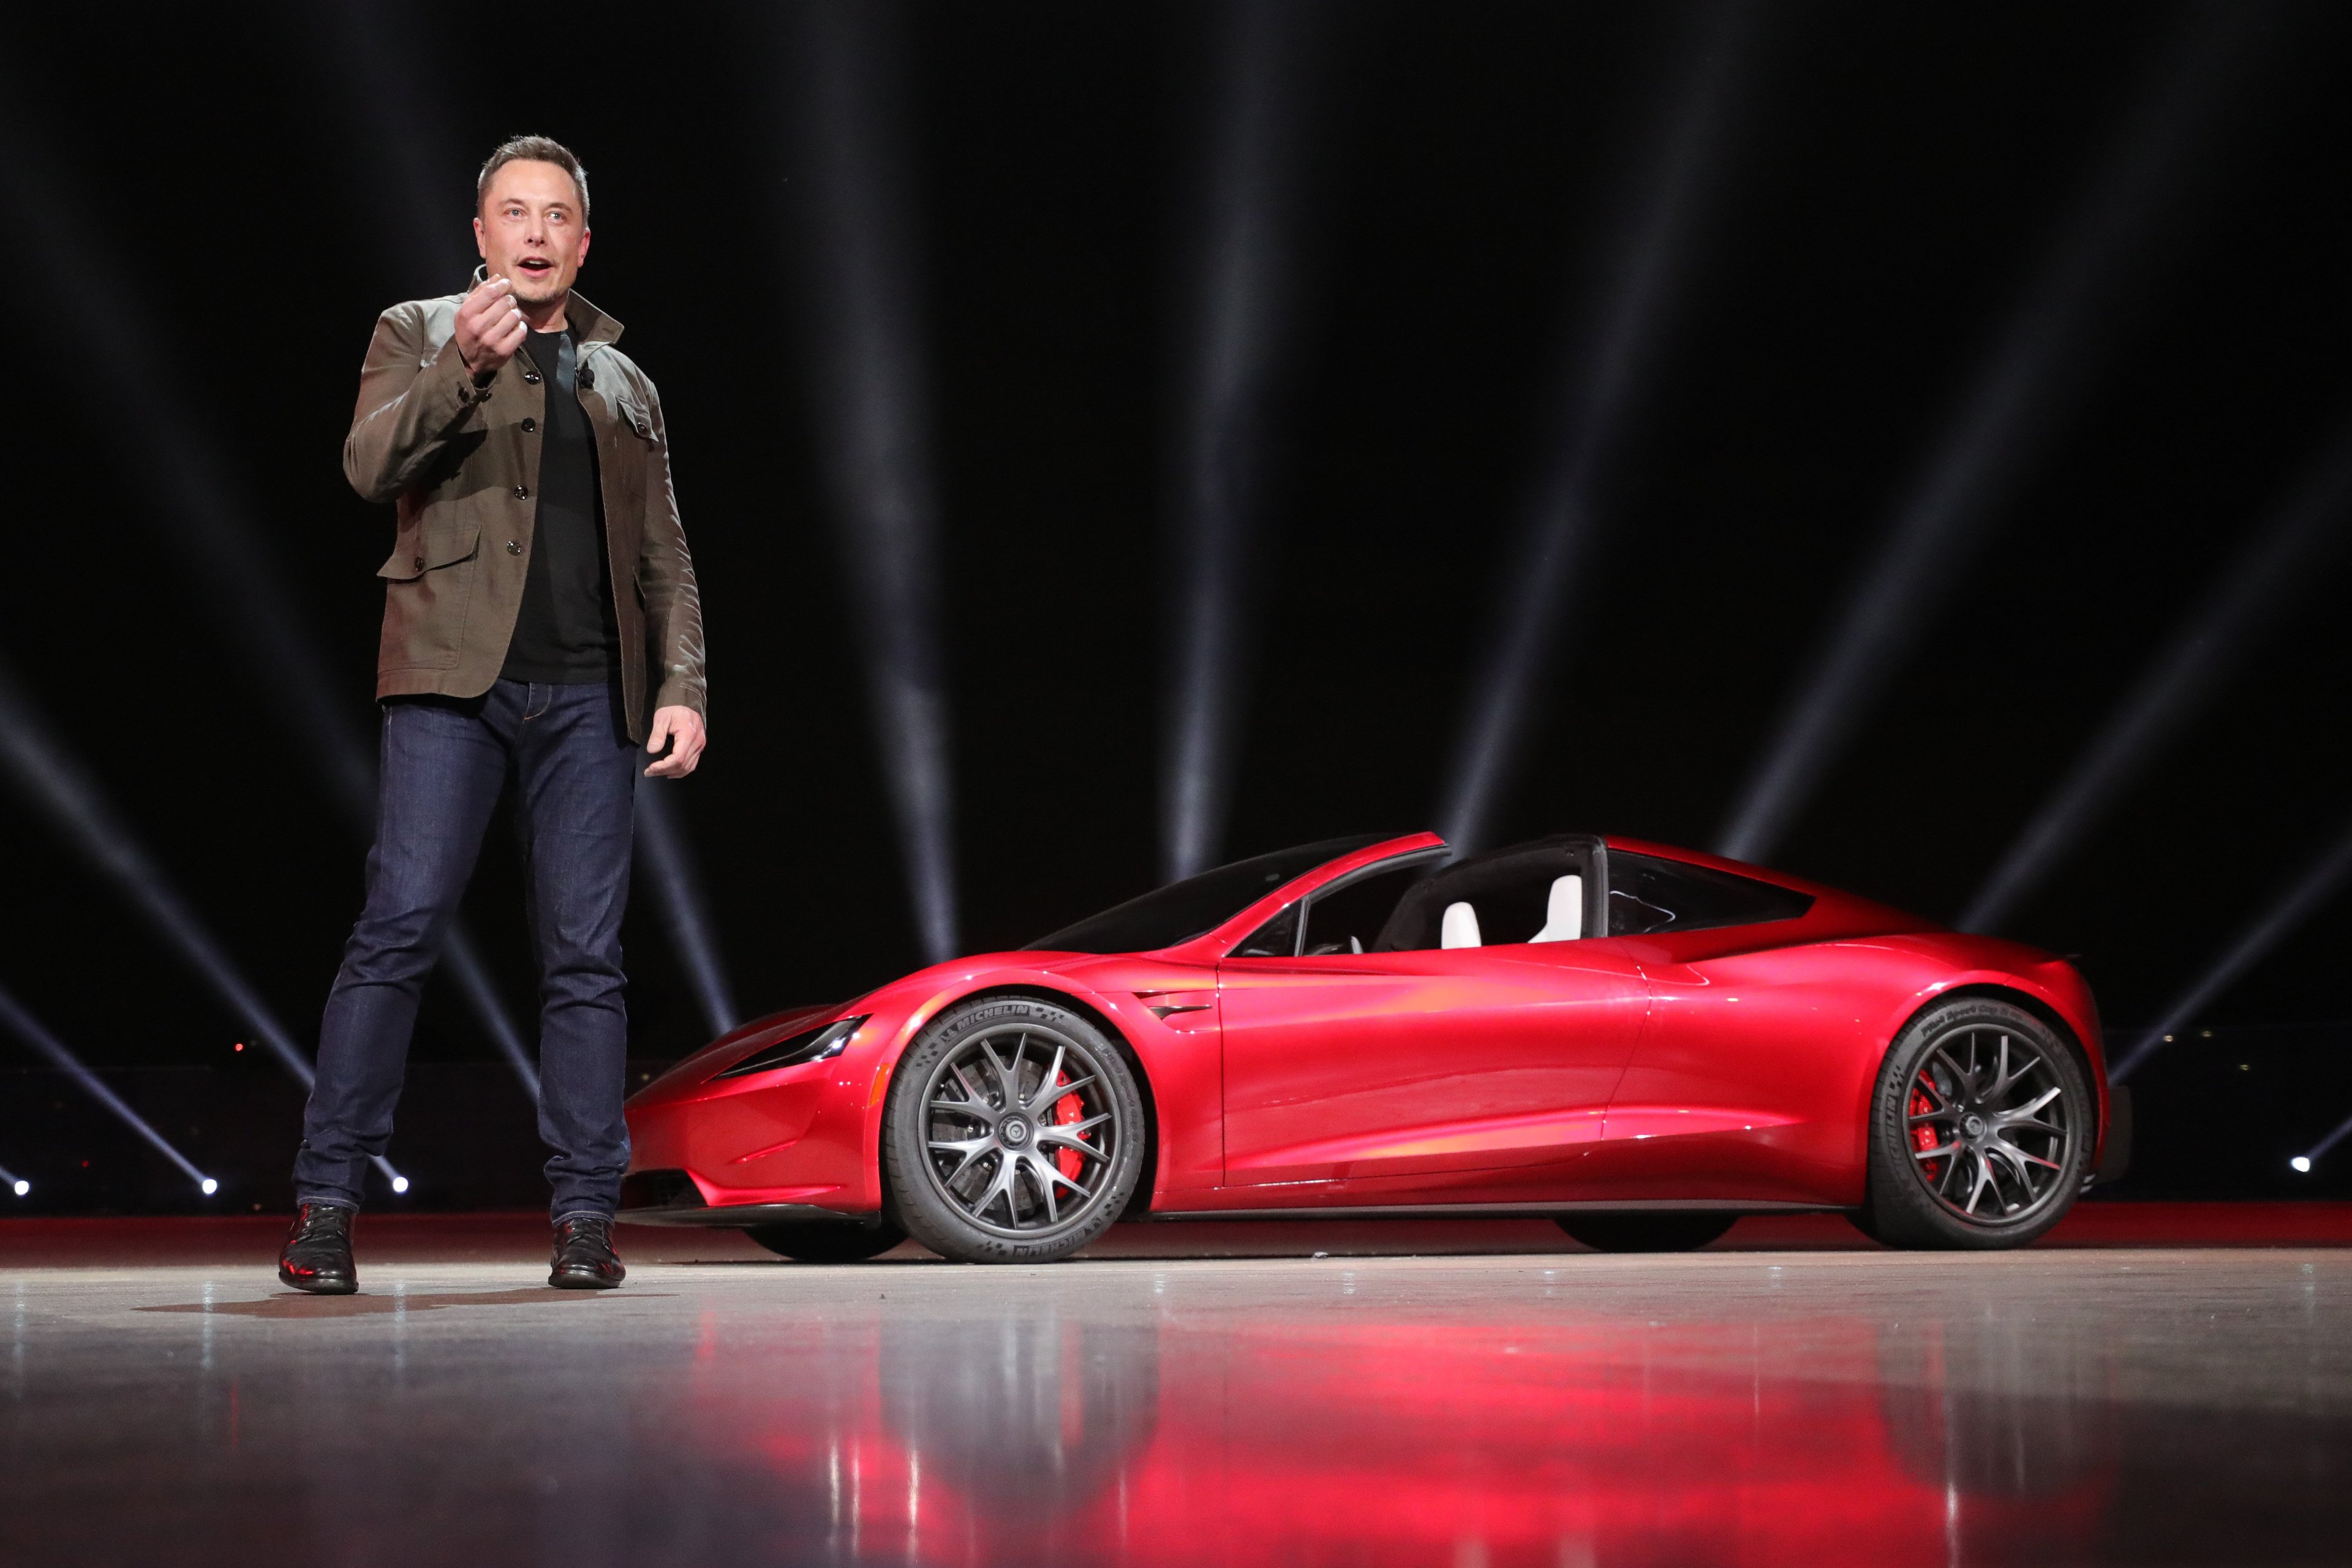
Elon Reeve Musk

Headquarters

Austin, TX 78725, US

TSLA Financials

Key Financial Metrics (TTM)

Gross Margin

19.29%

Operating Margin

3.35%

Net Income Margin

3.11%

Return on Equity

3.76%

Return on Capital

4.81%

Return on Assets

2.04%

Earnings Yield

0.24%

Dividend Yield

0.00%

Payout Ratio

2.18%

Stock Overview

Market Cap

$1.47TMarket cap calculated using publicly traded shares outstanding only. Does not include unlisted, private, or dual-class non-traded shares. Implied market cap may vary.

Shares Outstanding

3.95B

Volume

34.76M

Avg. Volume

37.09M

Financials (TTM)

Gross Profit

$19.97B

Operating Income

$3.47B

EBITDA

$11.27B

Operating Cash Flow

$18.71B

Capital Expenditure

-$15.41B

Free Cash Flow

$3.30B

Cash & ST Invst.

$45.45B

Total Debt

$16.45B

Tesla Performance Analysis

Tesla annual revenue and year-over-year revenue growth by fiscal year
Fiscal yearPeriod endRevenueYoY growth
20222022-12-31USD 81,462,000,00051.4%
20232023-12-31USD 96,773,000,00018.8%
20242024-12-31USD 97,690,000,0000.9%
20252025-12-31USD 94,827,000,000-2.9%
Tesla sequential (quarter-over-quarter) revenue growth by fiscal quarter
Fiscal quarterPeriod endQoQ growth
Q42025-12-31-11.4%
Q12026-03-31-10.1%
Q22026-06-3026.1%
Q32026-09-30-0.7%
Tesla annual diluted earnings per share and year-over-year EPS growth by fiscal year
Fiscal yearPeriod endDiluted EPSYoY growth
20222022-12-31USD 3.62122.0%
20232023-12-31USD 4.3018.8%
20242024-12-31USD 2.04-52.6%
20252025-12-31USD 1.08-47.2%
Tesla sequential (quarter-over-quarter) diluted earnings per share growth by fiscal quarter
Fiscal quarterPeriod endQoQ growth
Q42025-12-31-38.5%
Q12026-03-31-45.8%
Q22026-06-30146.2%
Q32026-09-30-31.3%

Revenue Growth Rate

Annual and quarterly growth comparison

Earnings Per Share Growth Rate

Annual and quarterly EPS growth comparison

Quarterly Performance

Name
Q3 2026YOY CHG

Revenue

$28.05B

-0.2%

Gross Profit

$5.49B

+8.7%

Gross Margin

19.59%

N/A

Market Cap

$1.47TMarket cap calculated using publicly traded shares outstanding only. Does not include unlisted, private, or dual-class non-traded shares. Implied market cap may vary.

N/A

Market Cap/Employee

$10.92M

N/A

Employees

134,785

N/A

Net Income

$787.00M

-42.7%

EBITDA

$2.90B

-20.8%

Quarterly Fundamentals

Name
Q3 2026YOY CHG

Total Cash

$45.45B

+7.6%

Total Debt

$16.45B

-13.2%

Accounts Receivable

$4.64B

-1.4%

Inventory

$14.09B

+14.8%

Long Term Debt

$13.98B

-13.2%

Short Term Debt

$2.46B

-13.5%

Return on Assets

2.04%

N/A

Return on Invested Capital

2.96%

N/A

Free Cash Flow

$1.53B

-61.6%

Operating Cash Flow

$6.26B

+0.4%

Other Investments to Explore

People Also Watch

Symbol / CompanyPricePrice Chg
BYDDYBYD Company Limited
$9.09+4.12%
GMGeneral Motors Company
$75.92-1.67%
FFord Motor Company
$11.60-2.85%
VWAGYVolkswagen AG
$7.64-0.53%

Trending Stocks

Symbol / CompanyPricePrice Chg
SPCXSpace Exploration Technologies
$147.49+1.89%
TAT&T
$20.93-7.96%
SOXLDirexion Shares ETF Trust - Direxion Daily Semiconductor Bull 3x ETF
$83.56+1.77%
NUNu Holdings
$15.16+2.92%

Questions About TSLA

What is the current price of Tesla?

Tesla is trading at $372.22 per share.

What is the 52-week range for Tesla?

Over the past 52 weeks, Tesla has traded between $297.38 and $498.83.

How much debt does Tesla have?

As of the most recent reporting period, Tesla reported total debt of $16.45B.

How much cash does Tesla have on hand?

Tesla reported $18.34B in cash and cash equivalents in its most recent financial results.

What is Tesla’s dividend yield?

Tesla does not currently have a dividend yield.

Premium Investing Services

Invest better with The Motley Fool. Get stock recommendations, portfolio guidance, and more from The Motley Fool's premium services.