H&R Block
(NYSE) HRB
H&R Block Financials at a Glance
Market Cap
$4.93B
Revenue (TTM)
$3.91B
Net Income (TTM)
$739.36M
EPS (TTM)
$5.62
P/E Ratio
6.92
Dividend
$1.64
Beta (Volatility)
0.52 (Low)
Dividend
$1.64
Beta (Volatility)
0.52 (Low)
Price
$38.93
Volume
54,823
Open
$37.81
Price
$38.93
Volume
54,823
Open
$37.81
Previous Close
$38.93
Daily Range
$37.81 - $39.14
52-Week Range
$28.16 - $59.05
Dividend
$1.64
Beta (Volatility)
0.52 (Low)
Price
$38.93
Volume
54,823
Open
$37.81
Previous Close
$38.93
Daily Range
$37.81 - $39.14
52-Week Range
$28.16 - $59.05
HRB News


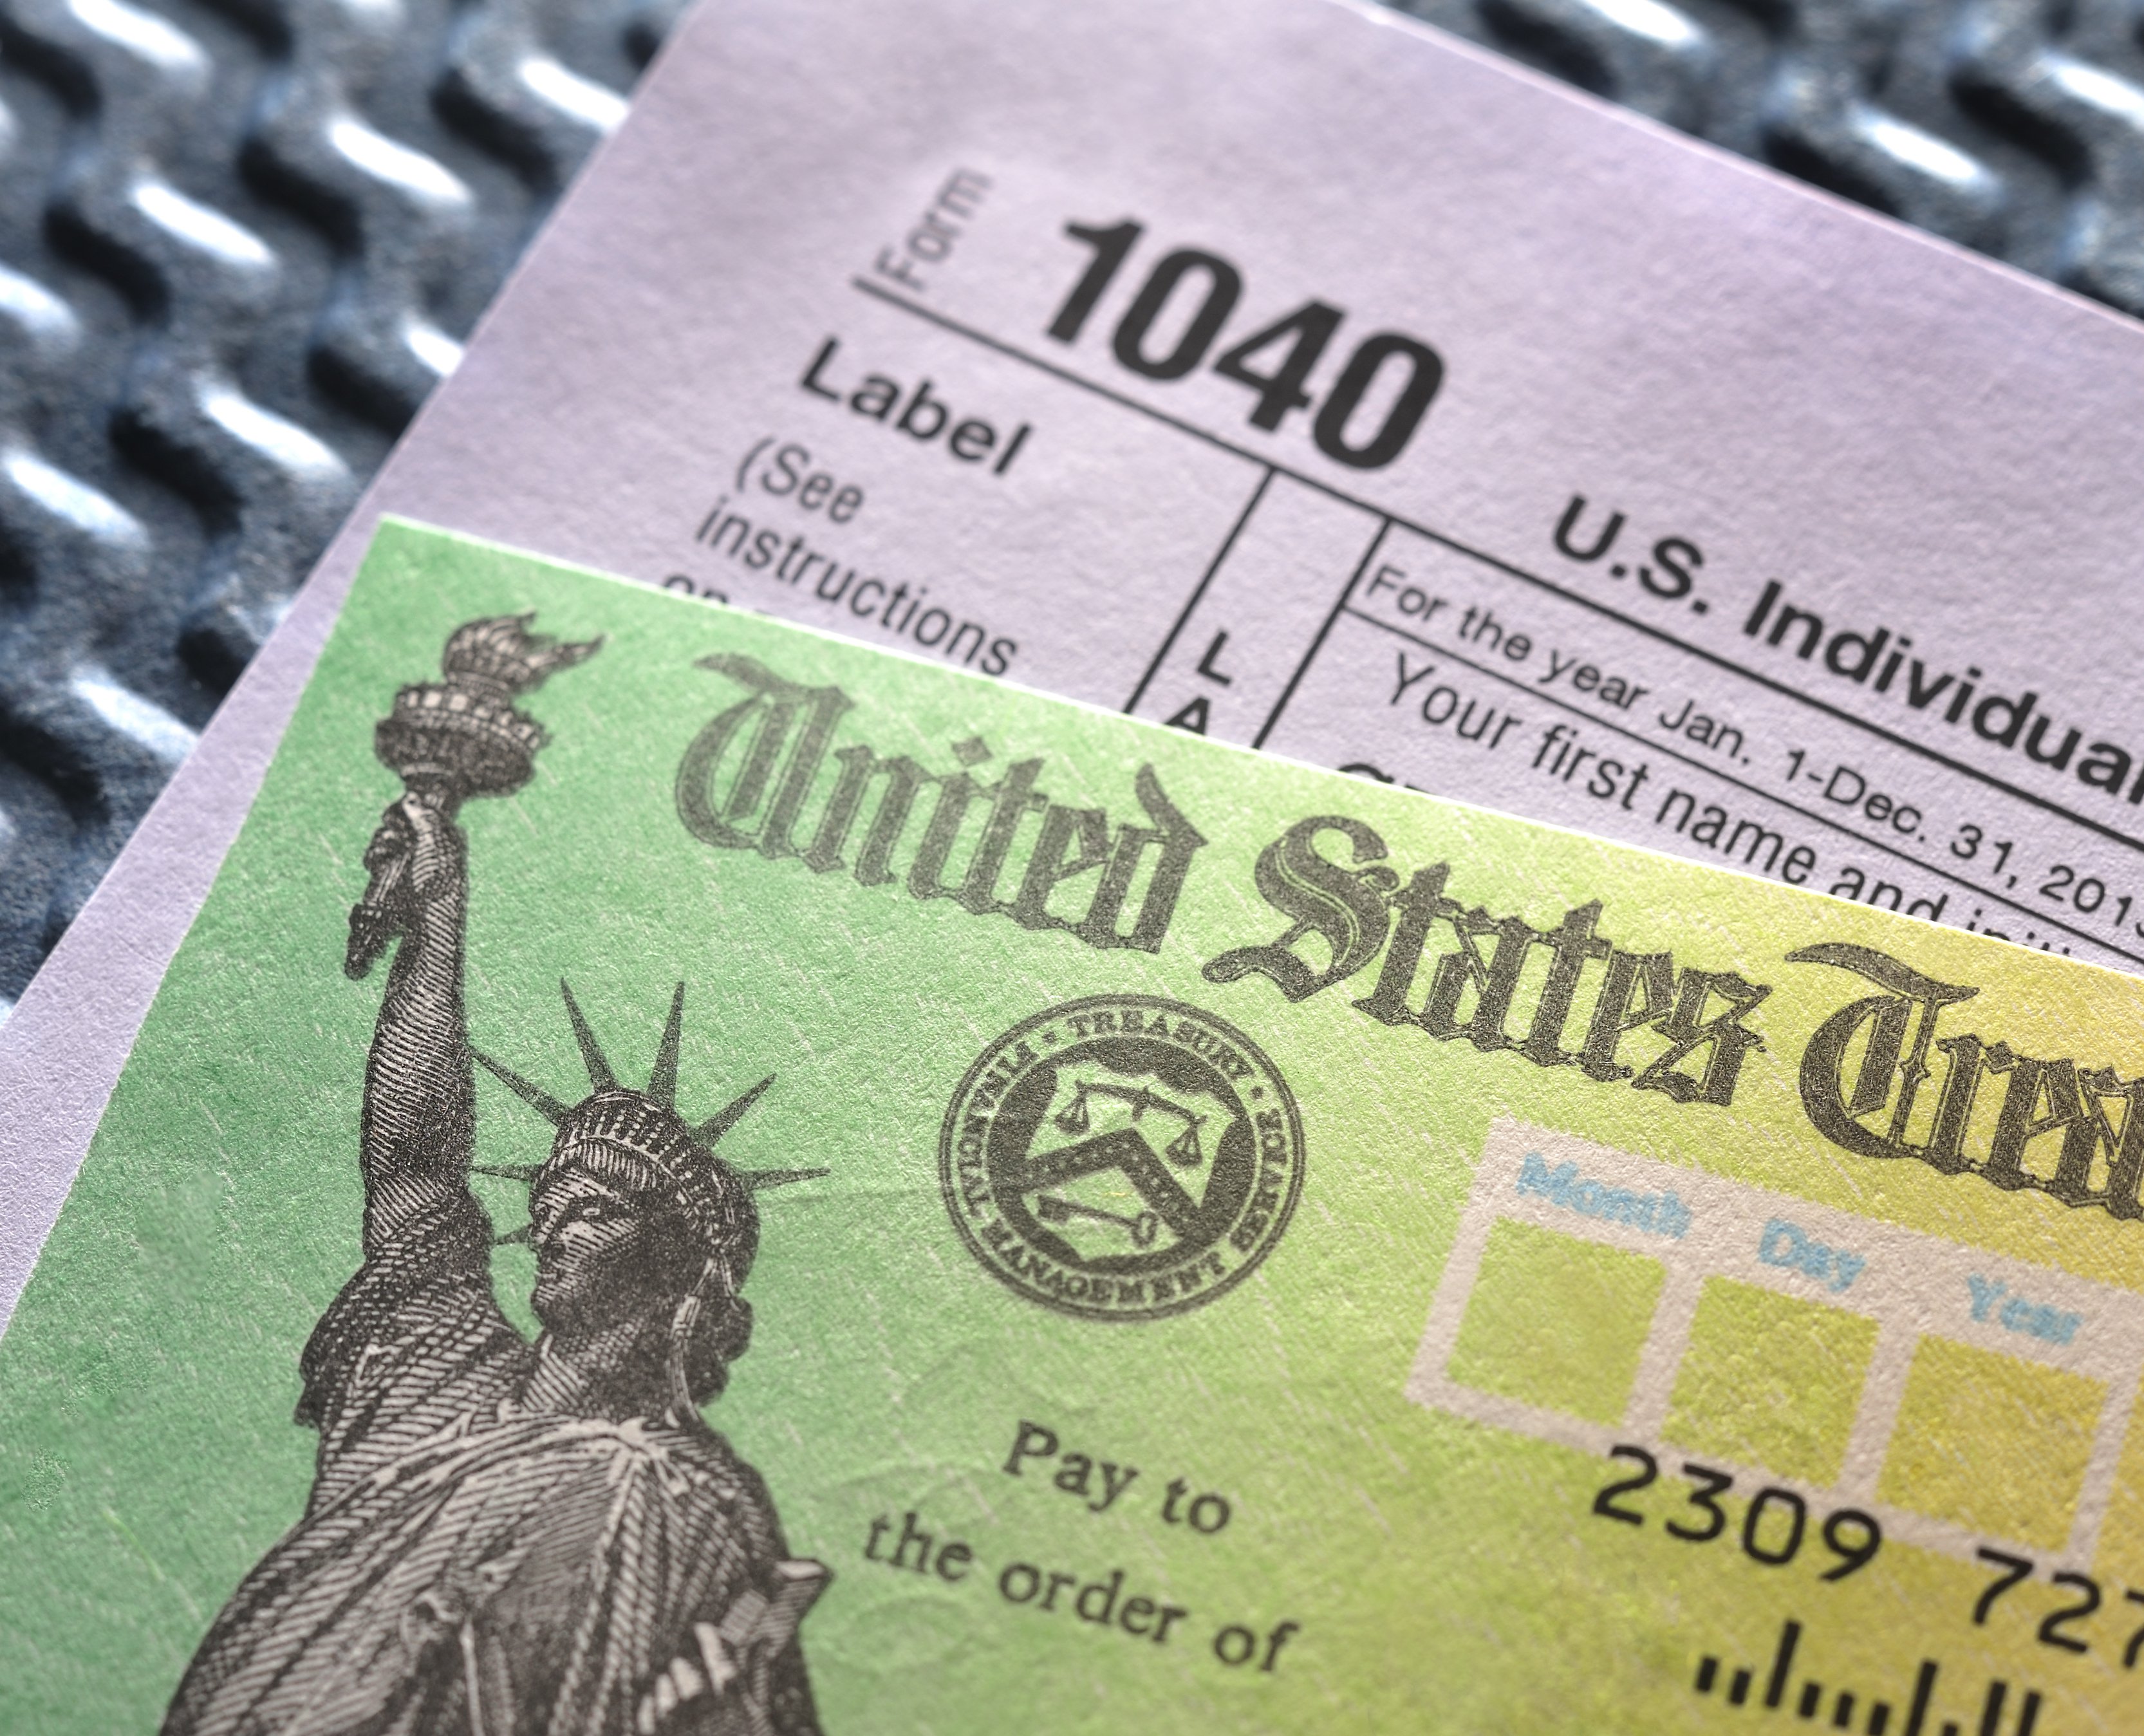
What Is a Tax Refund?


HRB: Motley Fool Moneyball Superscore
Our CEO Is Handing Members His Secret Weapon
It's called Motley Fool Moneyball, our new proprietary AI tool
We spent over half a million dollars in R&D to build a tool that makes stock research faster, sharper, and smarter. Our analysts use it every day, and now, you can too.
Get Access NowAbout H&R Block
Industry
Diversified Consumer Services
Sector
Consumer DiscretionaryEmployees
70,100
CEO
Curtis A. Campbell
Website
www.hrblock.comHeadquarters
Kansas City, MO 64105, US
HRB Financials
Key Financial Metrics (TTM)
Gross Margin
54%
Operating Margin
26%
Net Income Margin
19%
Return on Equity
673%
Return on Capital
49%
Return on Assets
22%
Earnings Yield
14.45%
Dividend Yield
4.20%
Payout Ratio
28.13%
Stock Overview
Market Cap
$4.93B
Shares Outstanding
126.76M
Volume
54.82K
Avg. Volume
2.53M
Financials (TTM)
Gross Profit
$1.67B
Operating Income
$827.97M
EBITDA
$976.34M
Operating Cash Flow
$680.88M
Capital Expenditure
$82.03M
Free Cash Flow
$598.85M
Cash & ST Invst.
$1.00B
Total Debt
$2.35B
H&R Block Performance Analysis
Revenue Growth Rate
Annual and quarterly growth comparisonEarnings Per Share Growth Rate
Annual and quarterly EPS growth comparisonQuarterly Performance
Revenue
$2.40B
+5.3%
Gross Profit
$1.37B
+4.5%
Gross Margin
56.97%
N/A
Market Cap
$4.93B
N/A
Market Cap/Employee
$1.17M
N/A
Employees
4,200
N/A
Net Income
$847.90M
+17.4%
EBITDA
$1.08B
+6.6%
Quarterly Fundamentals
Net Cash
$1.14B
+17.6%
Accounts Receivable
$297.64M
-15.5%
Inventory
$0.00
N/A
Long Term Debt
$1.82B
+10.2%
Short Term Debt
$209.27M
-60.0%
Return on Assets
21.80%
N/A
Return on Invested Capital
48.83%
N/A
Free Cash Flow
$1.54B
+18.2%
Operating Cash Flow
$1.56B
+17.6%