Accessibility Menu
Matson logo

Matson(NYSE) MATX

Market Cap$6.66BMarket cap calculated using publicly traded shares outstanding only. Does not include unlisted, private, or dual-class non-traded shares. Implied market cap may vary.
Since IPO (1983)+29,179%
5 Year+207%
1 Year+111%
1 Month+6%
Premium Feature
Moneyball Superscore
69/100
$222.73
+0.02%
+0.05Today
Matson last closing stock price
MetricPriceDate
Last closeUSD 222.682026-08-24
Matson stock price return by period
PeriodPrice returnPrice at period startPeriod start date
1 week+1.24%USD 219.952026-08-17
1 month+5.95%USD 210.182026-07-24
3 month+20.9%USD 184.192026-05-26
Year to date+81.32%USD 122.812025-12-31
1 year+111.42%USD 105.332025-08-22
3 year+164.36%USD 84.232023-08-25
5 year+207.24%USD 72.482021-08-25
Since inception+29,179.23%USD 0.761983-02-08

Matson Financials at a Glance

Market Cap

$6.66BMarket cap calculated using publicly traded shares outstanding only. Does not include unlisted, private, or dual-class non-traded shares. Implied market cap may vary.

Revenue (TTM)

$3.46B

Net Income (TTM)

$463.80M

EPS (TTM)

$14.96

P/E Ratio

14.89

Dividend

$1.46

Beta (Volatility)

1.10 (Average)

Price

$222.73

Volume

28,092.314

Open

$224.30

Previous Close

$222.68

Daily Range

$222.34 - $225.97

52-Week Range

$86.97 - $230.74

Estimated Earnings Date

Nov 3, 2026

MATX: Motley Fool Moneyball Superscore

69

Our CEO Is Handing Members His Secret Weapon

It's called Motley Fool Moneyball, our new proprietary AI tool

We spent over half a million dollars in R&D to build a tool that makes stock research faster, sharper, and smarter. Our analysts use it every day, and now, you can too.

Get Access Now

About Matson

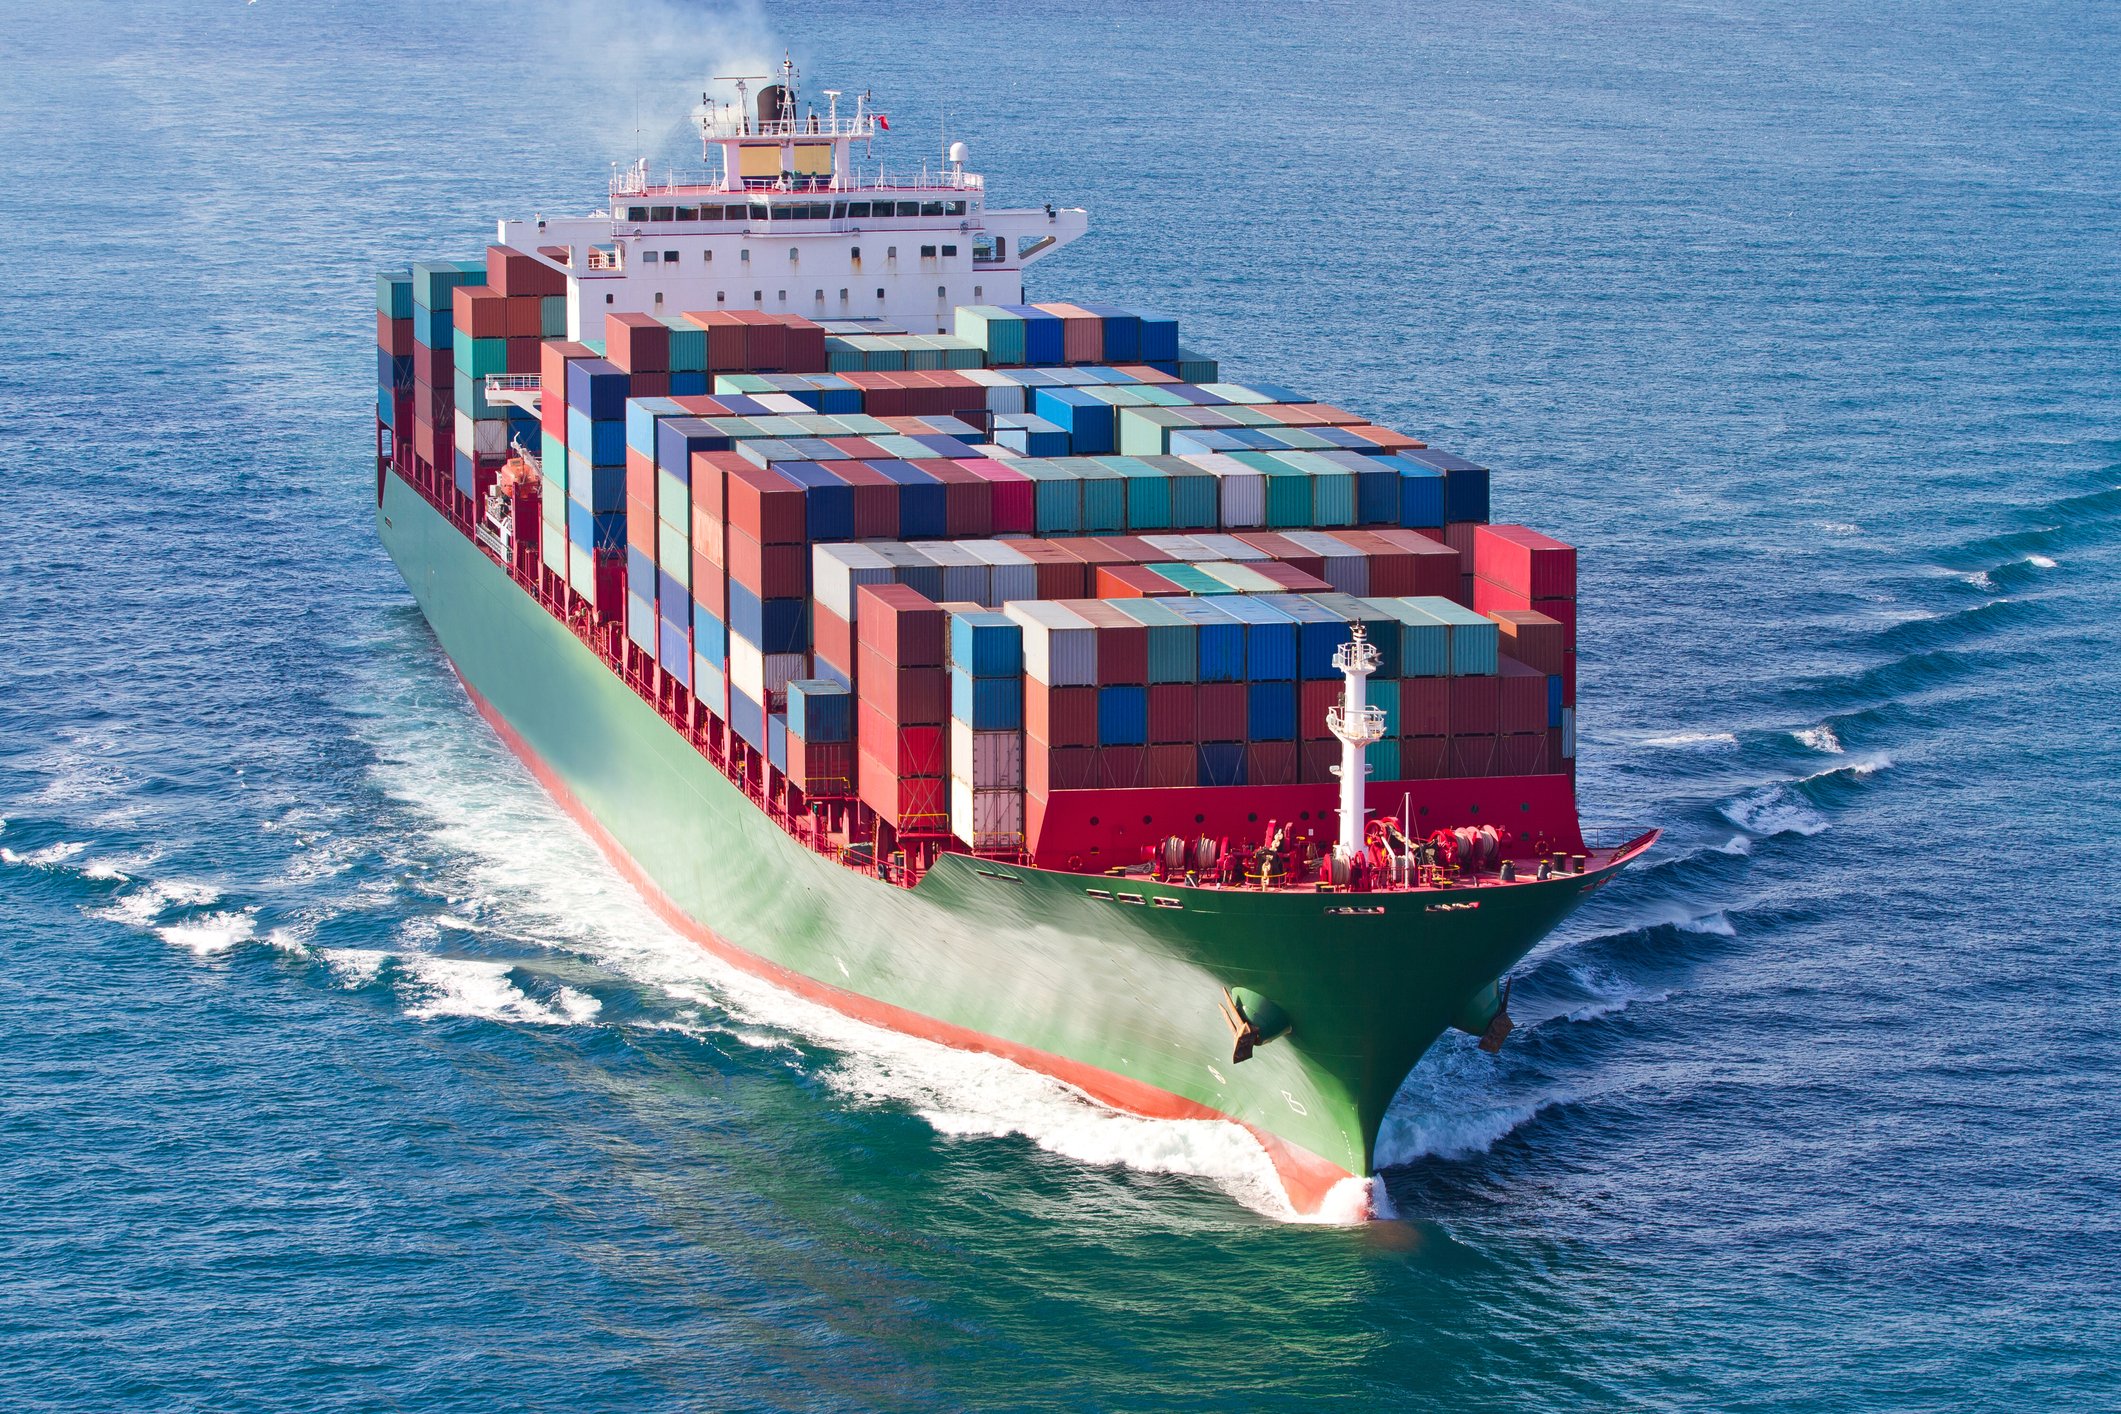
Matson, Inc. moves goods across the ocean to specific islands. It helps businesses ship everything from cars to food and clothes. The company also handles inland transport and storage for its customers.

Delivering to the Islands

  • Ocean Transportation: Shipping services for Hawaii, Alaska, Guam, and China; generated $767.4 million in revenue for the second quarter 2026.
  • Logistics: Multimodal transportation brokerage and rail intermodal services; earned $202.0 million in revenue during the second quarter 2026.
  • Terminal Operations: Container handling and maintenance services through a joint venture; contributed $4.8 million to income in the second quarter 2026.
  • Expedited China Service: High-speed freight services for e-commerce and garments; saw container volume rise 15.2% in the second quarter 2026.

Sailing Into New Waters

  • Invested $181.8 million in vessel construction during the second quarter 2026 for three new Aloha Class containerships.
  • Extended the share repurchase program on April 23, 2026, to allow for more stock buybacks through 2029.
  • Increased China service volume by 15.2% during the three months ended June 30, 2026, due to higher Transpacific demand.

The Matson Edge

Matson provides critical shipping services to non-contiguous domestic economies like Hawaii and Alaska where competitors are limited. It also operates specialized expedited routes from China that serve time-sensitive e-commerce and retail markets.

By the Numbers

  • Operating revenue reached $969.4 million in the second quarter 2026, up 16.7% year over year.
  • Net income hit $129.4 million during the three months ended June 30, 2026, up 36.6% year over year.
  • Total debt decreased to $341.3 million by June 30, 2026, following scheduled fixed interest repayments.
  • Price-to-earnings ratio was 11.2 in the second quarter 2026, up from 9.4 in the previous year.
  • The company repurchased 0.7 million shares for $122.2 million during the six months ended June 30, 2026.

The Final Word

Matson has evolved from a historical Pacific carrier into a modernized shipping and logistics provider. Its investments in new vessels and specialized China routes support its position in domestic and international trade.

AI Generated • Aug 4, 2026

Industry

Marine

Employees

4,170

CEO

Matthew J. Cox, CPA

Headquarters

Honolulu, HI 96819, US

MATX Financials

Key Financial Metrics (TTM)

Gross Margin

23.02%

Operating Margin

14.49%

Net Income Margin

13.41%

Return on Equity

16.94%

Return on Capital

13.40%

Return on Assets

9.84%

Earnings Yield

6.72%

Dividend Yield

0.66%

Payout Ratio

9.62%

Stock Overview

Market Cap

$6.66BMarket cap calculated using publicly traded shares outstanding only. Does not include unlisted, private, or dual-class non-traded shares. Implied market cap may vary.

Shares Outstanding

29.90M

Volume

28.09K

Avg. Volume

297.10K

Financials (TTM)

Gross Profit

$796.40M

Operating Income

$501.40M

EBITDA

$828.50M

Operating Cash Flow

$582.00M

Capital Expenditure

-$458.30M

Free Cash Flow

$123.70M

Cash & ST Invst.

$119.30M

Total Debt

$716.40M

Matson Performance Analysis

Matson annual revenue and year-over-year revenue growth by fiscal year
Fiscal yearPeriod endRevenueYoY growth
20222022-12-31USD 4,343,000,00010.6%
20232023-12-31USD 3,094,600,000-28.7%
20242024-12-31USD 3,421,800,00010.6%
20252025-12-31USD 3,344,500,000-2.3%
Matson sequential (quarter-over-quarter) revenue growth by fiscal quarter
Fiscal quarterPeriod endQoQ growth
Q32025-09-306.0%
Q42025-12-31-3.2%
Q12026-03-31-11.0%
Q22026-06-3027.9%
Matson annual diluted earnings per share and year-over-year EPS growth by fiscal year
Fiscal yearPeriod endDiluted EPSYoY growth
20222022-12-31USD 27.0726.1%
20232023-12-31USD 8.32-69.3%
20242024-12-31USD 13.9367.4%
20252025-12-31USD 13.81-0.8%
Matson sequential (quarter-over-quarter) diluted earnings per share growth by fiscal quarter
Fiscal quarterPeriod endQoQ growth
Q32025-09-3045.2%
Q42025-12-318.5%
Q12026-03-31-59.8%
Q22026-06-30130.8%

Revenue Growth Rate

Annual and quarterly growth comparison

Earnings Per Share Growth Rate

Annual and quarterly EPS growth comparison

Quarterly Performance

Name
Q2 2026YOY CHG

Revenue

$969.40M

+16.7%

Gross Profit

$232.10M

+28.9%

Gross Margin

23.94%

N/A

Market Cap

$6.66BMarket cap calculated using publicly traded shares outstanding only. Does not include unlisted, private, or dual-class non-traded shares. Implied market cap may vary.

N/A

Market Cap/Employee

$1.60M

N/A

Employees

4,170

N/A

Net Income

$129.40M

+36.6%

EBITDA

$242.70M

+23.2%

Quarterly Fundamentals

Name
Q2 2026YOY CHG

Total Cash

$119.30M

+101.9%

Total Debt

$716.40M

+7.7%

Accounts Receivable

$335.30M

+8.6%

Inventory

$0.00

N/A

Long Term Debt

$543.90M

+5.3%

Short Term Debt

$172.50M

+15.9%

Return on Assets

9.84%

N/A

Return on Invested Capital

12.20%

N/A

Free Cash Flow

-$99.90M

-151.3%

Operating Cash Flow

$137.60M

+30.3%

Other Investments to Explore

People Also Watch

Symbol / CompanyPricePrice Chg
CMBTCmb.Tech N.V.
$18.08-0.50%
KFYKorn Ferry
$84.17-0.67%
AZZAZZ Inc.
$140.53-0.17%
HAFNHafnia Limited
$8.16+0.31%

Trending Stocks

Symbol / CompanyPricePrice Chg
NVDANvidia
$211.52+0.01%
IBITiShares Bitcoin Trust
$44.81+0.00%
INTCIntel
$88.47+0.01%
BMNRBitmine Immersion Technologies
$25.32+0.05%

Questions About MATX

What is the current price of Matson?

Matson is trading at $222.95 per share.

What is the 52-week range for Matson?

Over the past 52 weeks, Matson has traded between $86.97 and $230.74.

How much debt does Matson have?

As of the most recent reporting period, Matson reported total debt of $332.40M.

How much cash does Matson have on hand?

Matson reported $119.30M in cash and cash equivalents in its most recent financial results.

What is Matson’s dividend yield?

Matson currently has a dividend yield of 0.66%.

Premium Investing Services

Invest better with The Motley Fool. Get stock recommendations, portfolio guidance, and more from The Motley Fool's premium services.