Accessibility Menu
Taylor Morrison Home logo

Taylor Morrison Home(NYSE) TMHC

Current Price$72.47
Market Cap$6.67BMarket cap calculated using publicly traded shares outstanding only. Does not include unlisted, private, or dual-class non-traded shares. Implied market cap may vary.
Since IPO (2013)+214%
5 Year+197%
1 Year+17%
1 Month+1%
Taylor Morrison Home last closing stock price
MetricPriceDate
Last closeUSD 72.482026-07-21
Taylor Morrison Home stock price return by period
PeriodPrice returnPrice at period startPeriod start date
1 week+0.75%USD 71.942026-07-14
1 month+1.26%USD 71.582026-06-18
3 month+11.51%USD 65.002026-04-22
Year to date+23.12%USD 58.872025-12-31
1 year+16.58%USD 62.172025-07-21
3 year+46.87%USD 49.352023-07-21
5 year+196.81%USD 24.422021-07-22
Since inception+214.41%USD 23.042013-04-10

Taylor Morrison Home Financials at a Glance

Market Cap

$6.67BMarket cap calculated using publicly traded shares outstanding only. Does not include unlisted, private, or dual-class non-traded shares. Implied market cap may vary.

Revenue (TTM)

$7.61B

Net Income (TTM)

$672.14M

EPS (TTM)

$6.71

P/E Ratio

10.81

Dividend

$0.00

Beta (Volatility)

1.17 (Average)

Price

$72.47

Volume

101,343

Open

$72.46

Previous Close

$72.47

Daily Range

$72.45 - $72.47

52-Week Range

$54.15 - $72.50

Estimated Earnings Date

Jul 22, 2026

TMHC: Motley Fool Moneyball Superscore

67

Our CEO Is Handing Members His Secret Weapon

It's called Motley Fool Moneyball, our new proprietary AI tool

We spent over half a million dollars in R&D to build a tool that makes stock research faster, sharper, and smarter. Our analysts use it every day, and now, you can too.

Get Access Now

About Taylor Morrison Home

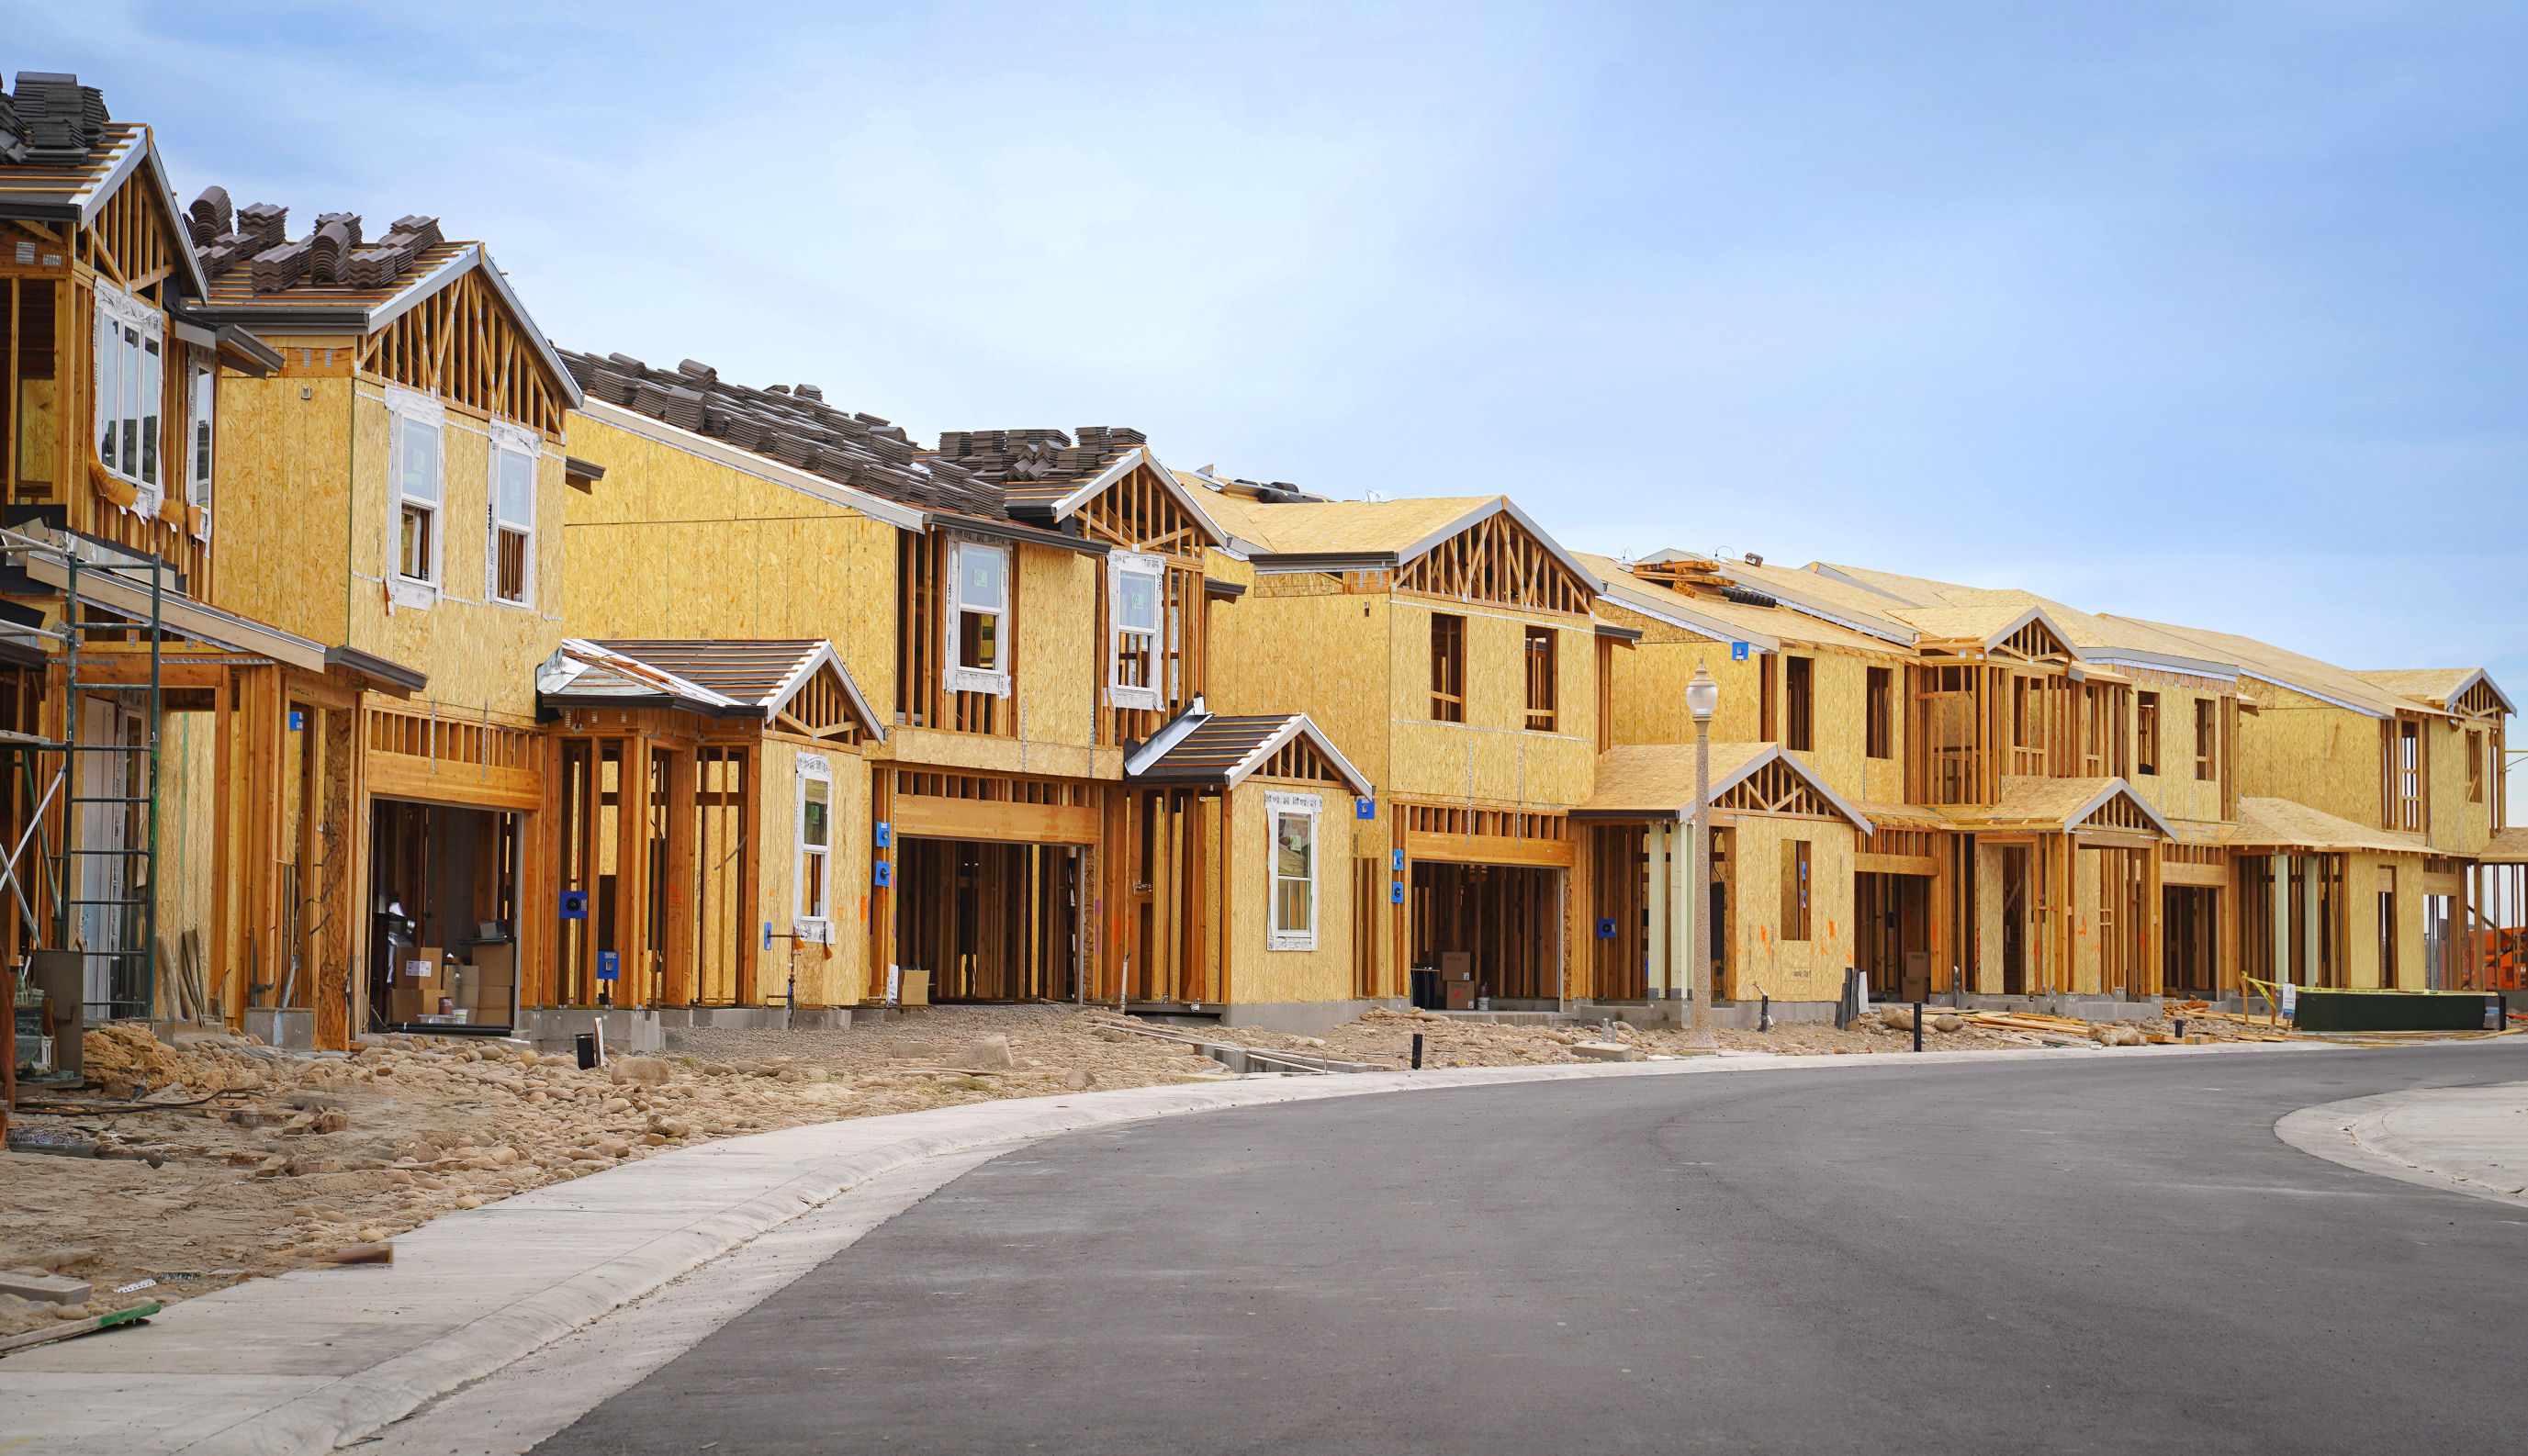
Taylor Morrison builds and sells houses for families in America. They help people buy everything from first homes to vacation properties. The company also provides mortgages and insurance for new homeowners.

What Kind of Homes?

  • Residential Homebuilding: Designs and constructs single and multi-family houses; generated $1.3 billion in net home closings revenue for Q1 2026.
  • Financial Services: Provides mortgage funding, title insurance, and closing services to homebuyers; earned $49.3 million in revenue during Q1 2026.
  • Build-to-Rent: Operates horizontal apartment communities under the Yardly brand name for the rental market.
  • Urban Form: Develops multi-use properties including retail, commercial space, and multi-family housing.

Recent Moves and Changes

  • Acquired AV Homes and its subsidiary Avatar Properties to expand residential operations.
  • Settled the Solivita litigation in February 2026 by agreeing to pay $22.6 million to resolve long-standing legal claims.
  • Reached an agreement to sell specific community amenities to the Solivita homeowner association.
  • Renewed a stock repurchase program in February 2026 with authorization to buy back up to $1 billion in common stock.

Building Across the Map

Taylor Morrison manages the entire homebuilding process as a general contractor across 12 states. Their business model controls land from development through final sale while offering in-house financial help to simplify the buying process.

The Latest Numbers

  • Total revenue fell to $1.4 billion in Q1 2026, down 26.8% from $1.9 billion in the same period last year.
  • Net income reached $100.4 million in Q1 2026, a decrease of 53% compared to Q1 2025.
  • Operating cash flow turned negative at -$10.4 million in Q1 2026, worsening from $77.2 million in Q1 2025.
  • Gross profit was $290.6 million for Q1 2026, down 37.7% from $466.4 million the previous year.
  • The company held $653 million in cash and cash equivalents as of March 31, 2026.

In Short

Taylor Morrison has transitioned into a multi-brand builder that manages both construction and consumer finance. The company continues to adjust its land holdings and product mix to meet changing buyer demand in high-growth US markets.

AI Generated • May 20, 2026

Industry

Household Durables

Employees

3,000

CEO

Sheryl D. Palmer

Headquarters

Scottsdale, AZ 85251, US

TMHC Financials

Key Financial Metrics (TTM)

Gross Margin

22.44%

Operating Margin

13.15%

Net Income Margin

8.83%

Return on Equity

10.85%

Return on Capital

13.11%

Return on Assets

6.88%

Earnings Yield

9.25%

Dividend Yield

0.00%

Payout Ratio

0.00%

Stock Overview

Market Cap

$6.67BMarket cap calculated using publicly traded shares outstanding only. Does not include unlisted, private, or dual-class non-traded shares. Implied market cap may vary.

Shares Outstanding

92.00M

Volume

101.34K

Avg. Volume

3.02M

Financials (TTM)

Gross Profit

$1.71B

Operating Income

$1.00B

EBITDA

$968.58M

Operating Cash Flow

$751.47M

Capital Expenditure

-$41.82M

Free Cash Flow

$709.65M

Cash & ST Invst.

$652.93M

Total Debt

$2.41B

Taylor Morrison Home Performance Analysis

Taylor Morrison Home annual revenue and year-over-year revenue growth by fiscal year
Fiscal yearPeriod endRevenueYoY growth
20222022-12-31USD 8,224,917,0009.6%
20232023-12-31USD 7,417,831,000-9.8%
20242024-12-31USD 8,168,136,00010.1%
20252025-12-31USD 8,121,480,000-0.6%
Taylor Morrison Home sequential (quarter-over-quarter) revenue growth by fiscal quarter
Fiscal quarterPeriod endQoQ growth
Q22025-06-307.1%
Q32025-09-303.2%
Q42025-12-310.2%
Q12026-03-31-33.9%
Taylor Morrison Home annual diluted earnings per share and year-over-year EPS growth by fiscal year
Fiscal yearPeriod endDiluted EPSYoY growth
20222022-12-31USD 9.0674.9%
20232023-12-31USD 6.98-22.9%
20242024-12-31USD 8.2718.4%
20252025-12-31USD 7.77-6.0%
Taylor Morrison Home sequential (quarter-over-quarter) diluted earnings per share growth by fiscal quarter
Fiscal quarterPeriod endQoQ growth
Q22025-06-30-7.2%
Q32025-09-304.7%
Q42025-12-31-12.4%
Q12026-03-31-42.6%

Revenue Growth Rate

Annual and quarterly growth comparison

Earnings Per Share Growth Rate

Annual and quarterly EPS growth comparison

Quarterly Performance

Name
Q1 2026YOY CHG

Revenue

$1.39B

-26.8%

Gross Profit

$290.64M

-37.7%

Gross Margin

20.95%

N/A

Market Cap

$6.67BMarket cap calculated using publicly traded shares outstanding only. Does not include unlisted, private, or dual-class non-traded shares. Implied market cap may vary.

N/A

Market Cap/Employee

$2.22M

N/A

Employees

3,000

N/A

Net Income

$100.43M

-53.0%

EBITDA

$152.57M

-48.5%

Quarterly Fundamentals

Name
Q1 2026YOY CHG

Total Cash

$652.93M

+72.8%

Total Debt

$2.41B

+11.9%

Accounts Receivable

$269.84M

+27.2%

Inventory

$6.14B

-3.4%

Long Term Debt

$2.41B

+11.9%

Short Term Debt

$0.00

N/A

Return on Assets

6.88%

N/A

Return on Invested Capital

11.42%

N/A

Free Cash Flow

-$20.39M

-129.7%

Operating Cash Flow

-$10.43M

-113.5%

Other Investments to Explore

People Also Watch

Symbol / CompanyPricePrice Chg
URBNUrban Outfitters, Inc.
$73.74-1.46%
MMacy's, Inc.
$23.80+2.10%
LEALear Corporation
$142.82+1.90%
IBPInstalled Building Products, Inc.
$222.09-0.95%

Trending Stocks

Symbol / CompanyPricePrice Chg
ONDSOndas
$7.66+0.11%
PATHUiPath
$12.04-0.01%
TAT&T
$22.26+0.01%
NOKNokia
$10.63+0.05%

Questions About TMHC

What is the current price of Taylor Morrison Home?

Taylor Morrison Home is trading at $72.47 per share.

What is the 52-week range for Taylor Morrison Home?

Over the past 52 weeks, Taylor Morrison Home has traded between $54.15 and $72.50.

How much debt does Taylor Morrison Home have?

As of the most recent reporting period, Taylor Morrison Home reported total debt of $2.41B.

How much cash does Taylor Morrison Home have on hand?

Taylor Morrison Home reported $653.43M in cash and cash equivalents in its most recent financial results.

What is Taylor Morrison Home’s dividend yield?

Taylor Morrison Home does not currently have a dividend yield.

Premium Investing Services

Invest better with The Motley Fool. Get stock recommendations, portfolio guidance, and more from The Motley Fool's premium services.