Tenaris logo

Tenaris(NYSE) TS

Market Cap$31.21BMarket cap calculated using publicly traded shares outstanding only. Does not include unlisted, private, or dual-class non-traded shares. Implied market cap may vary.
Since IPO (2002)+3,007%
5 Year+203%
1 Year+64%
1 Month+4%
Premium Feature
Moneyball Superscore
71/100
$59.38
+1.98%
+1.15Today
Tenaris last closing stock price
MetricPriceDate
Last closeUSD 58.232026-10-23
Tenaris stock price return by period
PeriodPrice returnPrice at period startPeriod start date
1 week-1.95%USD 59.392026-10-16
1 month+4.41%USD 55.772026-09-23
3 month+0.97%USD 57.672026-07-24
Year to date+54.43%USD 37.712025-12-31
1 year+64.24%USD 35.452025-10-23
3 year+101.03%USD 28.972023-10-24
5 year+203.04%USD 19.212021-10-22
Since inception+3,007.21%USD 1.872002-12-16

Tenaris Financials at a Glance

Market Cap

$31.21BMarket cap calculated using publicly traded shares outstanding only. Does not include unlisted, private, or dual-class non-traded shares. Implied market cap may vary.

Revenue (TTM)

$12.04B

Net Income (TTM)

$1.91B

EPS (TTM)

$3.74

P/E Ratio

15.55

Dividend

$1.78

Beta (Volatility)

0.73 (Low)

Price

$59.38

Volume

1,057,923.57

Open

$57.74

Previous Close

$58.23

Daily Range

$57.69 - $59.71

52-Week Range

$36.42 - $64.60

Estimated Earnings Date

Nov 4, 2026

TS: Motley Fool Moneyball Superscore

71

Our CEO Is Handing Members His Secret Weapon

It's called Motley Fool Moneyball, our new proprietary AI tool

We spent over half a million dollars in R&D to build a tool that makes stock research faster, sharper, and smarter. Our analysts use it every day, and now, you can too.

Get Access Now

About Tenaris

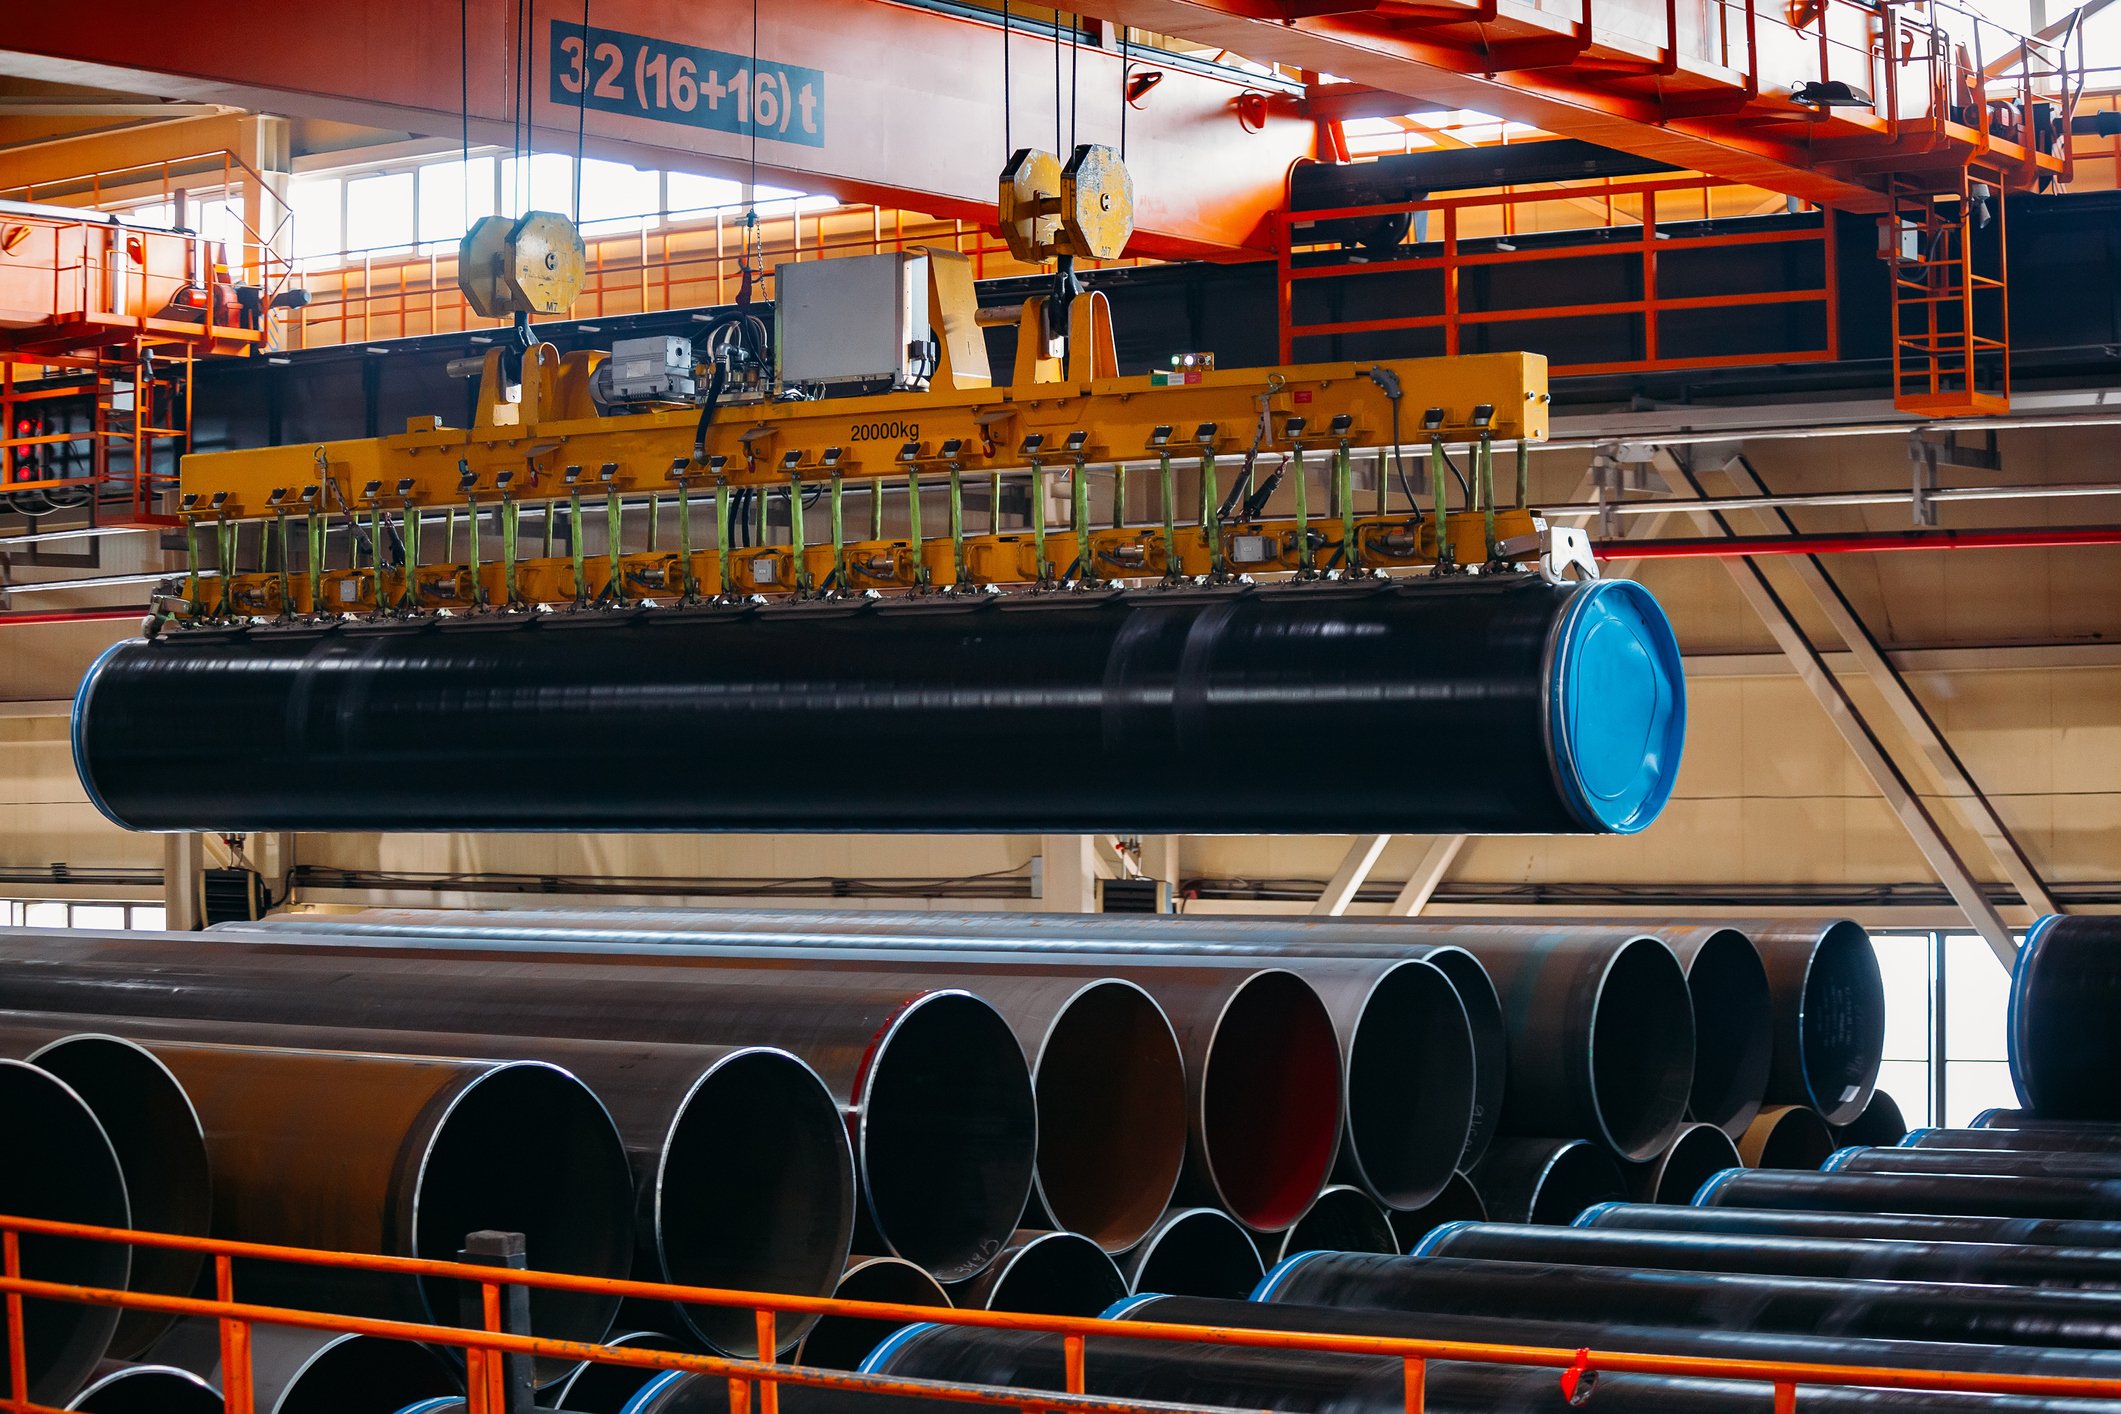
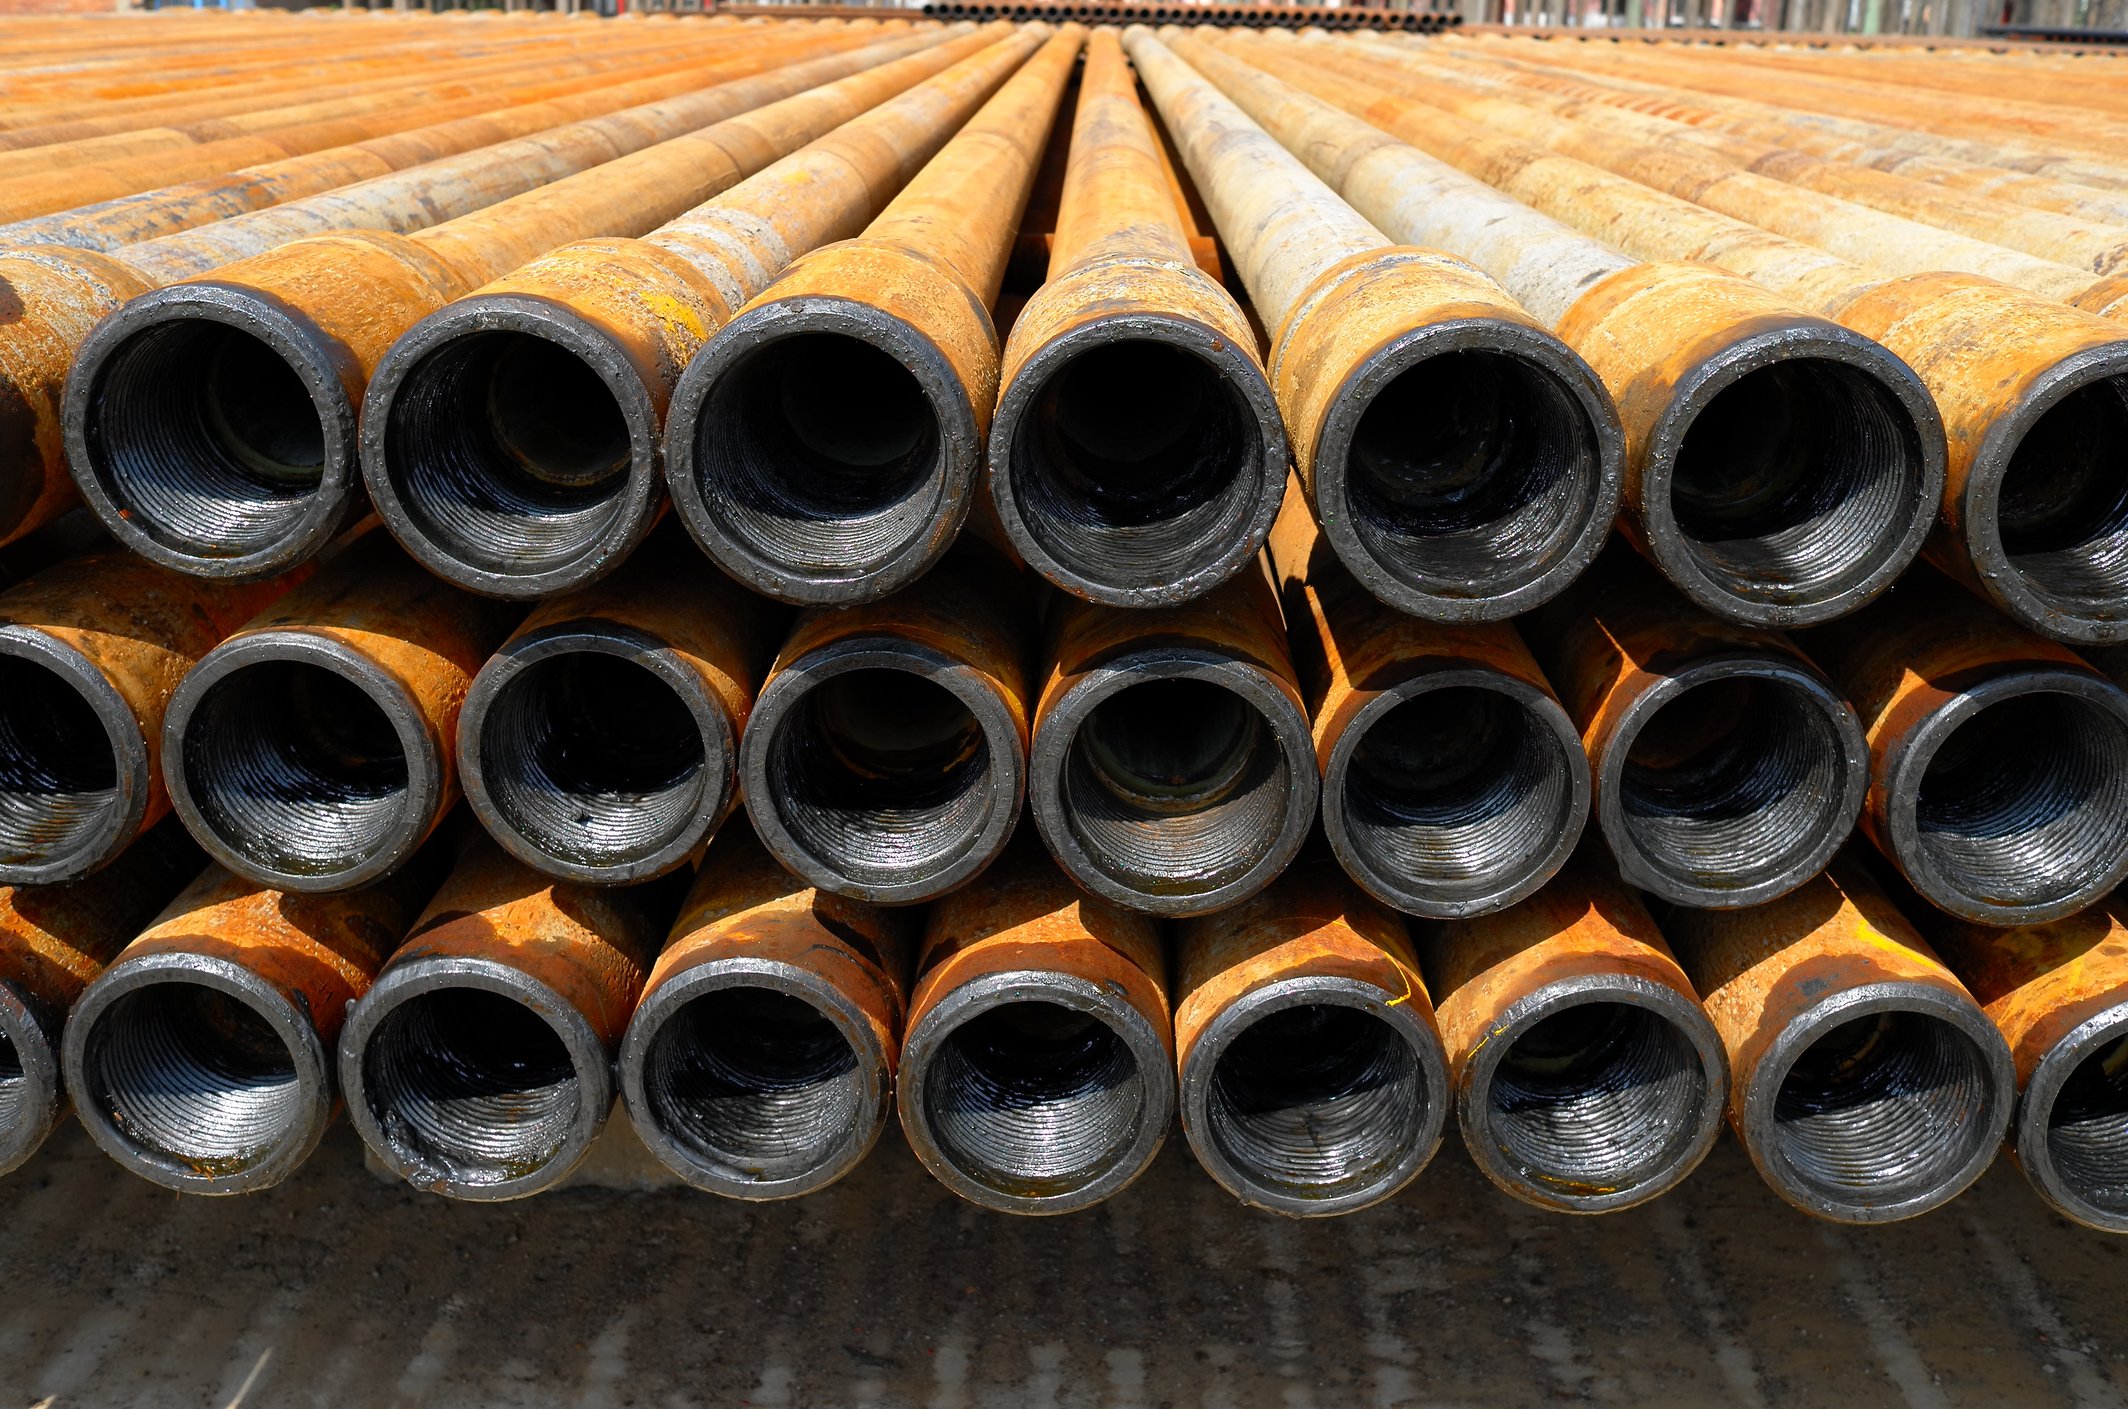
Tenaris S.A. is a leading manufacturer and supplier of steel pipe products and related services for the energy industry and other industrial applications. The company operates globally, with a strong presence in North America, South America, Europe, the Middle East, Africa, and the Asia Pacific.

Products and Services
  • Steel casings for oil and gas wells
  • Steel tubing for crude oil and natural gas transportation
  • Mechanical and structural pipes for high-pressure applications
Growth Outlook
  • Projected revenue growth driven by increased global energy demand
  • Expansion into emerging markets to capture new opportunities
  • Investment in innovative technologies to enhance product offerings
Financial Highlights
  • Q2 2026 revenue of $2.97 billion, reflecting strong market demand
  • Trailing twelve months net income margin of 15.87%
  • Dividend yield of 2.94%, indicating consistent shareholder returns
Tenaris S.A. has established itself as a key player in the oil and gas equipment and services sector. The company's diverse product range includes steel casings, tubing, and pipes, catering to various industrial applications. Recent financial performance highlights a robust revenue stream, with Q2 2026 revenue reaching $2.97 billion, showcasing the company's ability to capitalize on market demand. The growth outlook for Tenaris is promising, driven by increasing global energy needs and strategic expansions into emerging markets. Investments in innovative technologies further position the company to enhance its product offerings and maintain competitive advantages. Financially, Tenaris demonstrates strong performance metrics, including a net income margin of 15.87% over the trailing twelve months. The company also maintains a solid dividend yield of 2.94%, reflecting its commitment to returning value to shareholders. Overall, Tenaris S.A. presents a compelling opportunity for investors interested in the energy sector.
AI Generated • Oct 17, 2026

Industry

Energy Equipment and Services

Sector

Energy

Employees

24,875

CEO

Gabriel Podskubka

Headquarters

Luxembourg City, LU 2449, LU

TS Financials

Key Financial Metrics (TTM)

Gross Margin

33.72%

Operating Margin

18.71%

Net Income Margin

15.87%

Return on Equity

11.22%

Return on Capital

13.45%

Return on Assets

9.35%

Earnings Yield

6.43%

Dividend Yield

3.06%

Payout Ratio

47.28%

Stock Overview

Market Cap

$31.21BMarket cap calculated using publicly traded shares outstanding only. Does not include unlisted, private, or dual-class non-traded shares. Implied market cap may vary.

Shares Outstanding

536.00M

Volume

1.06M

Avg. Volume

1.28M

Financials (TTM)

Gross Profit

$4.08B

Operating Income

$2.23B

EBITDA

$3.15B

Operating Cash Flow

$2.27B

Capital Expenditure

-$538.21M

Free Cash Flow

$1.73B

Cash & ST Invst.

$2.78B

Total Debt

$446.95M

Tenaris Performance Analysis

Tenaris annual revenue and year-over-year revenue growth by fiscal year
Fiscal yearPeriod endRevenueYoY growth
20222022-12-31USD 11,768,969,06080.8%
20232023-12-31USD 14,891,888,41126.5%
20242024-12-31USD 12,501,811,054-16.0%
20252025-12-31USD 12,018,229,133-3.9%
Tenaris sequential (quarter-over-quarter) revenue growth by fiscal quarter
Fiscal quarterPeriod endQoQ growth
Q32025-09-30-3.9%
Q42025-12-311.0%
Q12026-03-313.9%
Q22026-06-30-4.7%
Tenaris annual diluted earnings per share and year-over-year EPS growth by fiscal year
Fiscal yearPeriod endDiluted EPSYoY growth
20222022-12-31USD 4.33132.6%
20232023-12-31USD 6.6653.8%
20242024-12-31USD 3.61-45.8%
20252025-12-31USD 3.671.8%
Tenaris sequential (quarter-over-quarter) diluted earnings per share growth by fiscal quarter
Fiscal quarterPeriod endQoQ growth
Q32025-09-30-18.0%
Q42025-12-314.9%
Q12026-03-3120.9%
Q22026-06-30-9.6%

Revenue Growth Rate

Annual and quarterly growth comparison

Earnings Per Share Growth Rate

Annual and quarterly EPS growth comparison

Quarterly Performance

Name
Q2 2026YOY CHG

Revenue

$2.97B

-3.9%

Gross Profit

$984.66M

-8.2%

Gross Margin

33.19%

N/A

Market Cap

$31.21BMarket cap calculated using publicly traded shares outstanding only. Does not include unlisted, private, or dual-class non-traded shares. Implied market cap may vary.

N/A

Market Cap/Employee

$1.25M

N/A

Employees

24,875

N/A

Net Income

$477.14M

-10.2%

EBITDA

$741.31M

-8.1%

Quarterly Fundamentals

Name
Q2 2026YOY CHG

Total Cash

$2.78B

-8.9%

Total Debt

$446.95M

-5.4%

Accounts Receivable

$2.34B

-1.1%

Inventory

$3.72B

+6.6%

Long Term Debt

$98.58M

+0.1%

Short Term Debt

$348.37M

-6.8%

Return on Assets

9.35%

N/A

Return on Invested Capital

12.36%

N/A

Free Cash Flow

$425.02M

-26.1%

Operating Cash Flow

$546.29M

-24.8%

Other Investments to Explore

People Also Watch

Symbol / CompanyPricePrice Chg
HALHalliburton Company
$35.49+1.62%
NOVNOV Inc.
$20.18+2.13%
BKRBaker Hughes Company
$56.04+0.32%
WFRDWeatherford International plc
$88.94+2.40%

Trending Stocks

Symbol / CompanyPricePrice Chg
NUNu Holdings
$12.60-16.92%
EWZiShares - iShares Msci Brazil ETF
$33.91-20.38%
ITUBItaú Unibanco
$7.66-20.79%
XPXP
$15.40-49.38%

Questions About TS

What is the current price of Tenaris?

Tenaris is trading at $59.39 per share.

What is the 52-week range for Tenaris?

Over the past 52 weeks, Tenaris has traded between $36.42 and $64.60.

How much debt does Tenaris have?

As of the most recent reporting period, Tenaris reported total debt of $446.95M.

How much cash does Tenaris have on hand?

Tenaris reported $557.06M in cash and cash equivalents in its most recent financial results.

What is Tenaris’s dividend yield?

Tenaris currently has a dividend yield of 3.06%.

Premium Investing Services

Invest better with The Motley Fool. Get stock recommendations, portfolio guidance, and more from The Motley Fool's premium services.