Accessibility Menu
Beam Therapeutics logo

Beam Therapeutics(NASDAQ) BEAM

Market Cap$2.68BMarket cap calculated using publicly traded shares outstanding only. Does not include unlisted, private, or dual-class non-traded shares. Implied market cap may vary.
Since IPO (2020)+39%
5 Year-72%
1 Year+31%
1 Month-26%
$25.98
-0.15%
-0.04Today
Beam Therapeutics last closing stock price
MetricPriceDate
Last closeUSD 26.022026-07-29
Beam Therapeutics stock price return by period
PeriodPrice returnPrice at period startPeriod start date
1 week-2.33%USD 26.642026-07-22
1 month-25.55%USD 34.952026-06-29
3 month-14.21%USD 30.332026-04-30
Year to date-6.13%USD 27.722025-12-31
1 year+30.56%USD 19.932025-07-29
3 year-17.08%USD 31.382023-07-28
5 year-71.72%USD 92.002021-07-30
Since inception+38.77%USD 18.752020-02-06

Beam Therapeutics Financials at a Glance

Market Cap

$2.68BMarket cap calculated using publicly traded shares outstanding only. Does not include unlisted, private, or dual-class non-traded shares. Implied market cap may vary.

Revenue (TTM)

$164.01M

Net Income (TTM)

-$65.04M

EPS (TTM)

-$0.69

P/E Ratio

-37.87

Dividend

$0.00

Beta (Volatility)

2.08 (High)

Price

$25.98

Volume

57,130.791

Open

$26.03

Previous Close

$26.02

Daily Range

$25.76 - $26.26

52-Week Range

$15.60 - $38.26

Estimated Earnings Date

Aug 4, 2026

BEAM: Motley Fool Moneyball Superscore

65

Our CEO Is Handing Members His Secret Weapon

It's called Motley Fool Moneyball, our new proprietary AI tool

We spent over half a million dollars in R&D to build a tool that makes stock research faster, sharper, and smarter. Our analysts use it every day, and now, you can too.

Get Access Now

About Beam Therapeutics

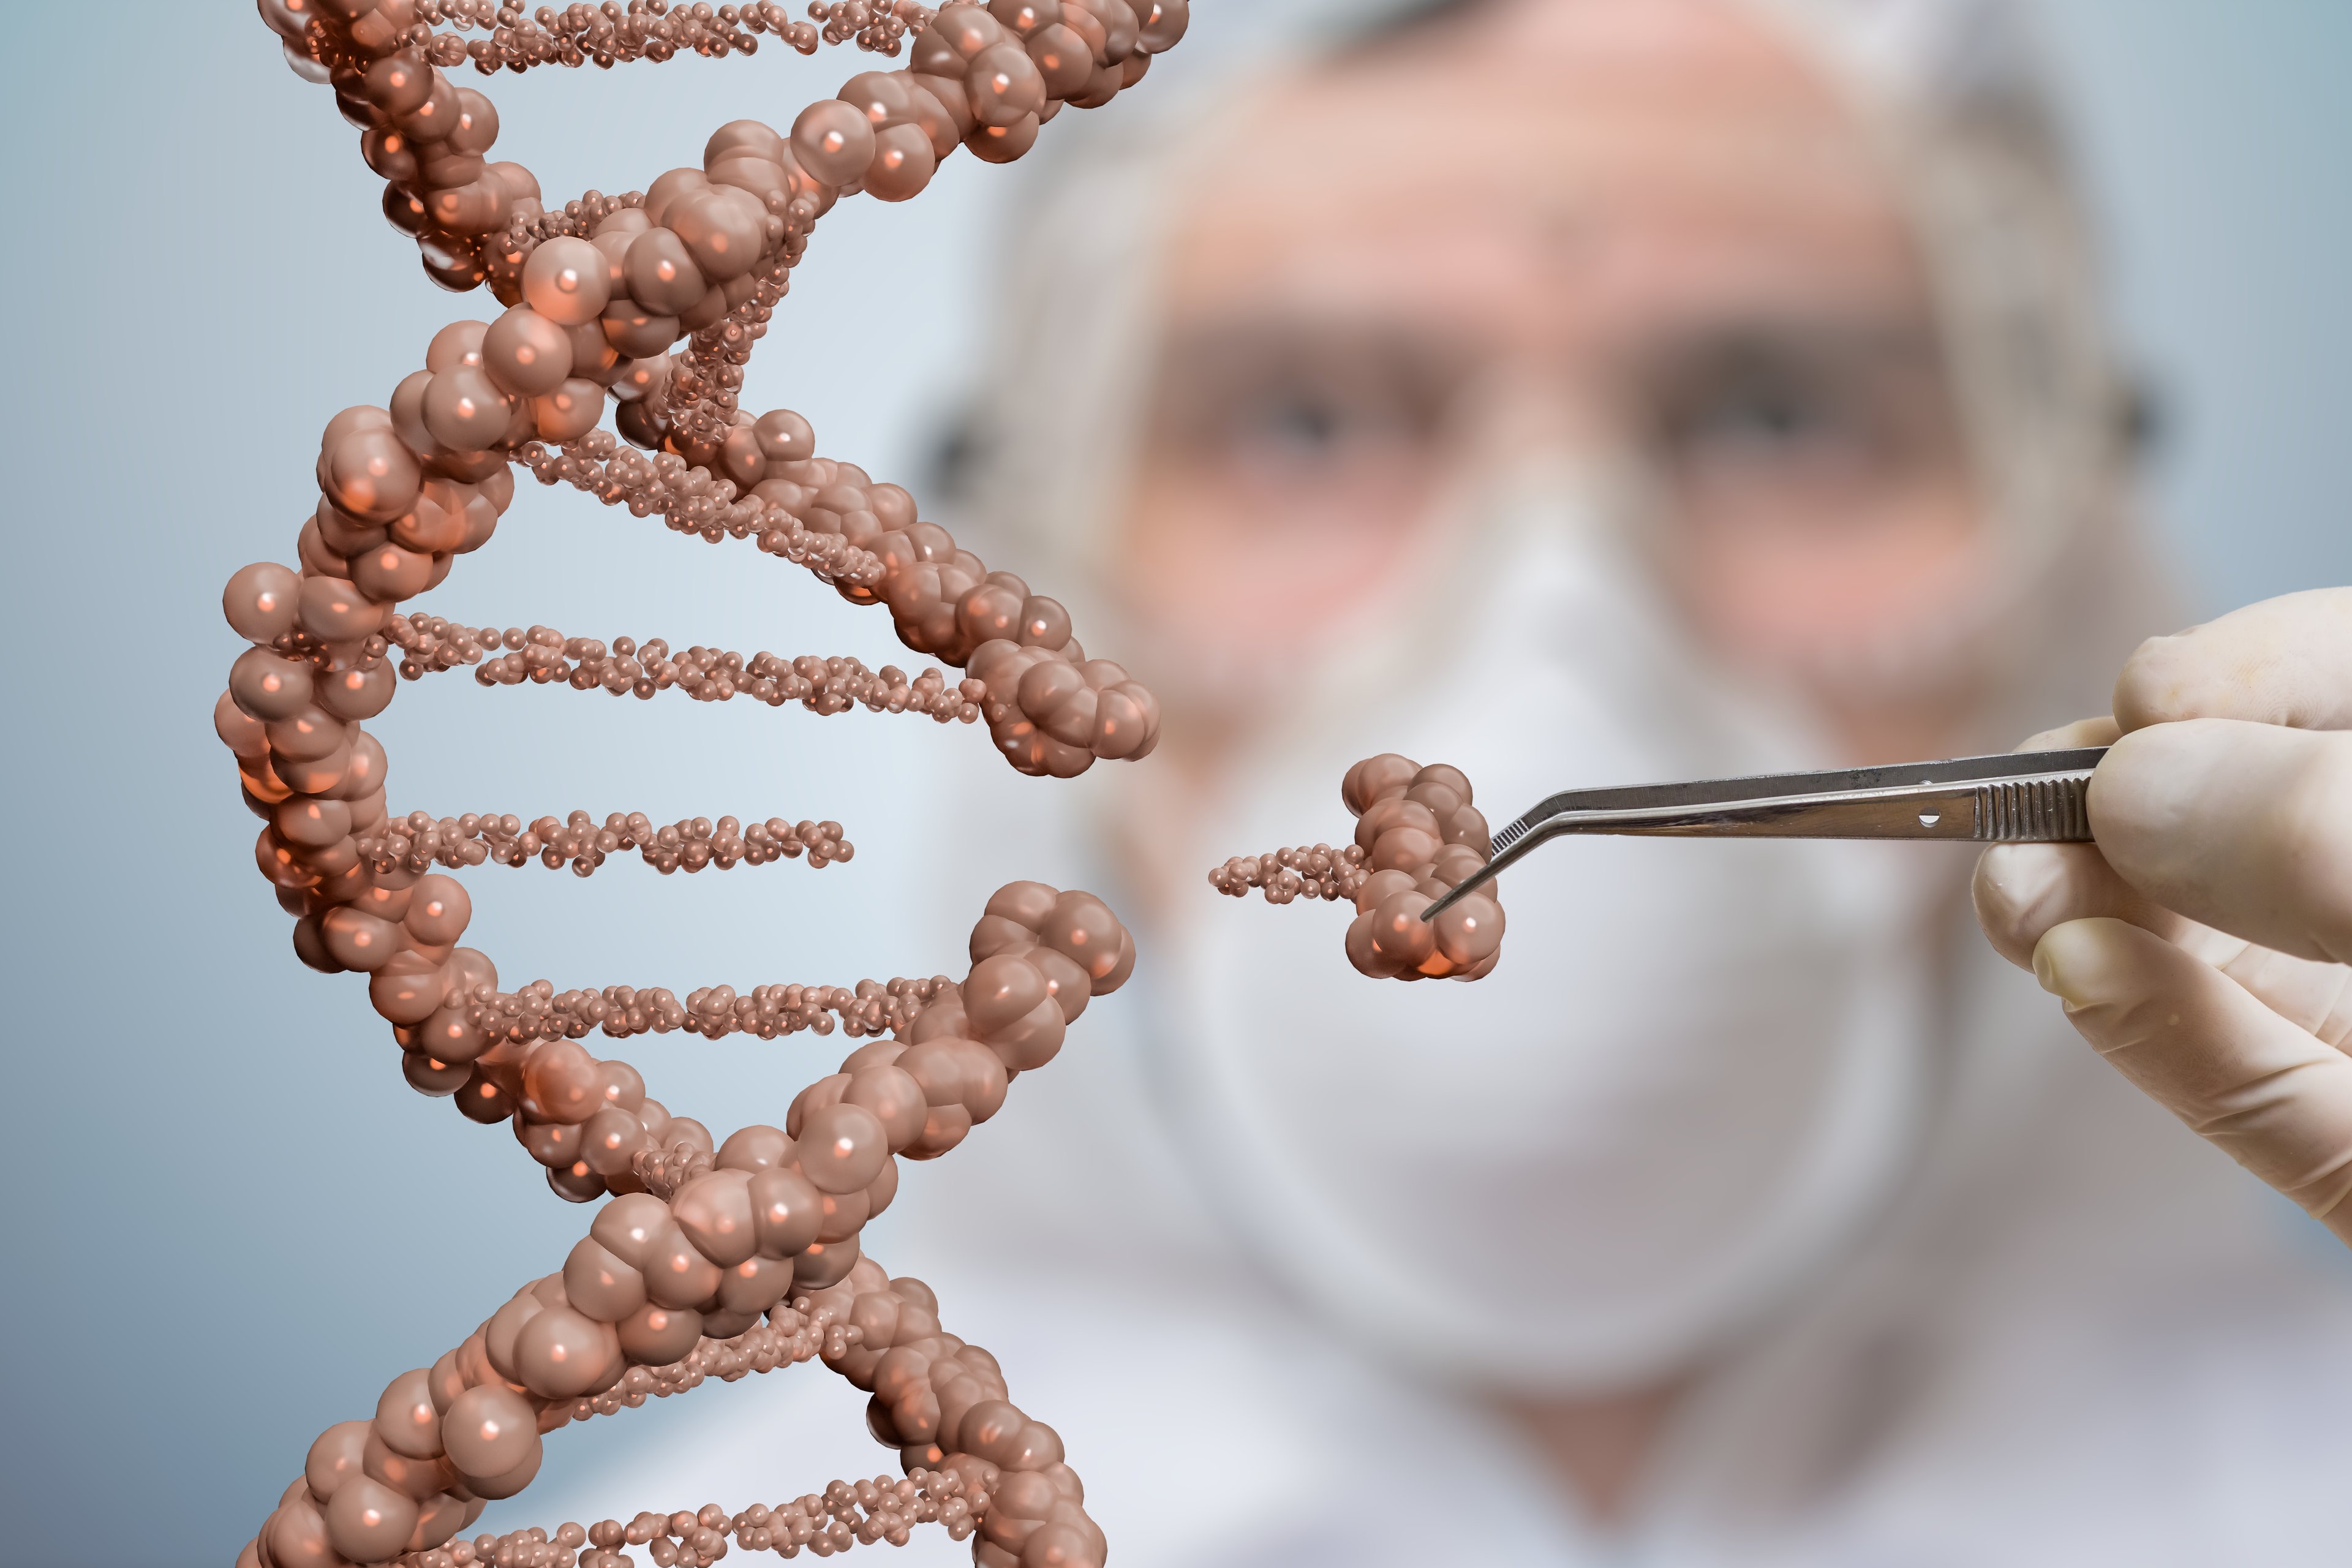
Beam makes medicines that fix tiny errors in a person's DNA. These treatments help people born with serious blood and liver diseases. The company aims to provide permanent cures by correcting genes directly.

The Genetic Toolbox

  • Sickle Cell Therapy: A treatment called risto-cel fixes blood cells to help patients with painful sickle cell disease.
  • Liver Disease Programs: Medicines like BEAM-302 and BEAM-301 target genetic issues in the liver to prevent organ damage.
  • Leukemia Treatment: An experimental therapy called BEAM-201 uses modified immune cells to fight specific types of blood cancer.
  • Delivery Technology: Tools like lipid nanoparticles—tiny fat bubbles—carry the genetic fixes into the right parts of the body.

New Partners and Paths

  • Entered a financing agreement with Sixth Street Lending Partners in February 2026 for a $100 million credit facility.
  • Transferred certain rights to Eli Lilly and Company in October 2023, receiving a $200 million upfront payment.
  • Maintains ongoing research collaborations with major firms including Pfizer and Apellis Pharmaceuticals.
  • Acquired an early-stage life sciences company in July 2025 to expand its research and development pipeline.

What Makes Beam Different?

Beam uses base editing technology to change single letters of DNA without cutting both strands of the genetic code. This approach aims to reduce the risk of unwanted genetic changes while achieving high precision in treatments.

Measuring the Money

  • Revenue reached $31.7 million in Q1 2026, up 324.9% from $7.5 million in Q1 2025.
  • Net loss narrowed to $94.3 million in Q1 2026, a 13.7% improvement from the previous year.
  • Total cash and marketable securities reached $1.2 billion as of March 31, 2026.
  • Operating cash flow deepened to a loss of $128.5 million in Q1 2026, worsened by 23.7% year-over-year.

Bottom Line

Beam has transitioned from a pure research firm into a biotech company with several active human clinical trials. By combining precision gene editing with internal manufacturing, it seeks to build a sustainable platform for genetic cures.

AI Generated • May 24, 2026

Industry

Biotechnology

Employees

511

CEO

John Evans, MBA

Headquarters

Cambridge, MA 02142, US

BEAM Financials

Key Financial Metrics (TTM)

Gross Margin

-39.17%

Operating Margin

-226.58%

Net Income Margin

-39.66%

Return on Equity

-5.89%

Return on Capital

-25.04%

Return on Assets

-4.39%

Earnings Yield

-2.64%

Dividend Yield

0.00%

Payout Ratio

0.00%

Stock Overview

Market Cap

$2.68BMarket cap calculated using publicly traded shares outstanding only. Does not include unlisted, private, or dual-class non-traded shares. Implied market cap may vary.

Shares Outstanding

102.88M

Volume

57.13K

Avg. Volume

2.27M

Financials (TTM)

Gross Profit

-$64.24M

Operating Income

-$371.62M

EBITDA

-$32.03M

Operating Cash Flow

-$369.73M

Capital Expenditure

-$14.11M

Free Cash Flow

-$383.84M

Cash & ST Invst.

$1.21B

Total Debt

$250.82M

Beam Therapeutics Performance Analysis

Beam Therapeutics annual revenue and year-over-year revenue growth by fiscal year
Fiscal yearPeriod endRevenueYoY growth
20222022-12-31USD 60,920,00017.5%
20232023-12-31USD 377,709,000520.0%
20242024-12-31USD 63,518,000-83.2%
20252025-12-31USD 139,743,000120.0%
Beam Therapeutics sequential (quarter-over-quarter) revenue growth by fiscal quarter
Fiscal quarterPeriod endQoQ growth
Q22025-06-3013.3%
Q32025-09-3014.6%
Q42025-12-311076.6%
Q12026-03-31-72.2%
Beam Therapeutics annual diluted earnings per share and year-over-year EPS growth by fiscal year
Fiscal yearPeriod endDiluted EPSYoY growth
20222022-12-31USD -4.13-28.5%
20232023-12-31USD -1.72-58.4%
20242024-12-31USD -4.58166.5%
20252025-12-31USD -0.81-82.3%
Beam Therapeutics sequential (quarter-over-quarter) diluted earnings per share growth by fiscal quarter
Fiscal quarterPeriod endQoQ growth
Q22025-06-3019.4%
Q32025-09-30-10.0%
Q42025-12-31311.8%
Q12026-03-31-139.1%

Revenue Growth Rate

Annual and quarterly growth comparison

Earnings Per Share Growth Rate

Annual and quarterly EPS growth comparison

Quarterly Performance

Name
Q1 2026YOY CHG

Revenue

$31.74M

+324.9%

Gross Profit

$20.68M

+122.6%

Gross Margin

65.16%

N/A

Market Cap

$2.68BMarket cap calculated using publicly traded shares outstanding only. Does not include unlisted, private, or dual-class non-traded shares. Implied market cap may vary.

N/A

Market Cap/Employee

$5.13M

N/A

Employees

522

N/A

Net Income

-$94.32M

+13.7%

EBITDA

-$88.71M

+14.5%

Quarterly Fundamentals

Name
Q1 2026YOY CHG

Total Cash

$1.21B

-0.7%

Total Debt

$250.82M

+58.6%

Accounts Receivable

$0.00

N/A

Inventory

$0.00

N/A

Long Term Debt

$236.04M

+62.9%

Short Term Debt

$14.78M

+11.9%

Return on Assets

-4.39%

N/A

Return on Invested Capital

-26.43%

N/A

Free Cash Flow

-$130.75M

-22.2%

Operating Cash Flow

-$128.51M

-23.7%

Other Investments to Explore

People Also Watch

Symbol / CompanyPricePrice Chg
MLYSMineralys Therapeutics, Inc.
$25.98-1.42%
ETNB89bio, Inc.
$14.84+0.00%
IDYAIDEAYA Biosciences, Inc.
$35.64+0.14%
RCUSArcus Biosciences, Inc.
$27.24+2.89%

Trending Stocks

Symbol / CompanyPricePrice Chg
NUWENuwellis
$5.42+1.87%
MSFTMicrosoft
$448.32+0.15%
NOKNokia
$9.19+0.09%
MUUDirexion Shares ETF Trust - Direxion Daily Mu Bull 2x Shares
$23.74+0.21%

Questions About BEAM

What is the current price of Beam Therapeutics?

Beam Therapeutics is trading at $25.99 per share.

What is the 52-week range for Beam Therapeutics?

Over the past 52 weeks, Beam Therapeutics has traded between $15.60 and $38.26.

How much debt does Beam Therapeutics have?

As of the most recent reporting period, Beam Therapeutics reported total debt of $250.82M.

How much cash does Beam Therapeutics have on hand?

Beam Therapeutics reported $288.29M in cash and cash equivalents in its most recent financial results.

What is Beam Therapeutics’s dividend yield?

Beam Therapeutics does not currently have a dividend yield.

Premium Investing Services

Invest better with The Motley Fool. Get stock recommendations, portfolio guidance, and more from The Motley Fool's premium services.