Accessibility Menu
Equinix logo

Equinix(NASDAQ) EQIX

Market Cap$108.30BMarket cap calculated using publicly traded shares outstanding only. Does not include unlisted, private, or dual-class non-traded shares. Implied market cap may vary.
Since IPO (2000)+255%
5 Year+43%
1 Year+44%
1 Month+6%
$1,086.24
-1.04%
-11.37Today
After hours$1,084.97-$1.27 (-0.12%)
Equinix last closing stock price
MetricPriceDate
Last closeUSD 1,085.092026-08-18
Equinix stock price return by period
PeriodPrice returnPrice at period startPeriod start date
1 week+5.1%USD 1,032.402026-08-11
1 month+6.38%USD 1,020.002026-07-17
3 month+1.88%USD 1,065.062026-05-20
Year to date+43.1%USD 758.262025-12-31
1 year+44.19%USD 752.532025-08-18
3 year+54.19%USD 703.752023-08-18
5 year+43.05%USD 758.522021-08-19
Since inception+255.34%USD 308.892000-08-11

Equinix Financials at a Glance

Market Cap

$108.30BMarket cap calculated using publicly traded shares outstanding only. Does not include unlisted, private, or dual-class non-traded shares. Implied market cap may vary.

Revenue (TTM)

$9.83B

Net Income (TTM)

$1.53B

EPS (TTM)

$15.54

P/E Ratio

70.64

Dividend

$19.70

Beta (Volatility)

0.85 (Low)

Price

$1,086.24

Volume

418,035

Open

$1,103.58

Previous Close

$1,085.09

Daily Range

$1,084.90 - $1,107.41

52-Week Range

$720.62 - $1,128.68

Estimated Earnings Date

Nov 4, 2026

EQIX: Motley Fool Moneyball Superscore

80

Our CEO Is Handing Members His Secret Weapon

It's called Motley Fool Moneyball, our new proprietary AI tool

We spent over half a million dollars in R&D to build a tool that makes stock research faster, sharper, and smarter. Our analysts use it every day, and now, you can too.

Get Access Now

About Equinix

Equinix helps companies store and connect their digital data safely. It runs a global network of specialized buildings for computer servers. These centers let businesses share data quickly with partners and customers.

What Powers the Digital World?

  • Colocation Services: Providing secure space and power for customer servers; included in recurring revenue that is over 90% of revenue.
  • Interconnection Solutions: Physical and virtual links that let businesses exchange data directly; included in recurring revenue that is over 90% of revenue.
  • Professional Services: Installation and technical consulting for digital infrastructure setups; represents less than 10% of revenue.
  • Edge Solutions: Tools for deploying networking and hardware closer to where data is actually used.

Global Expansion and New Partnerships

  • Sold the Hampton Campus data center assets in Jan. 2026 for $459 million.
  • Agreed to contribute up to $963 million in Feb. 2026 for a stake in Nordic provider atNorth.
  • Issued $2.4 billion in senior notes during the first half of 2026 to support business growth.
  • Reached a global footprint of 282 data centers across 77 markets as of June 30, 2026.

Why the Company Stands Out

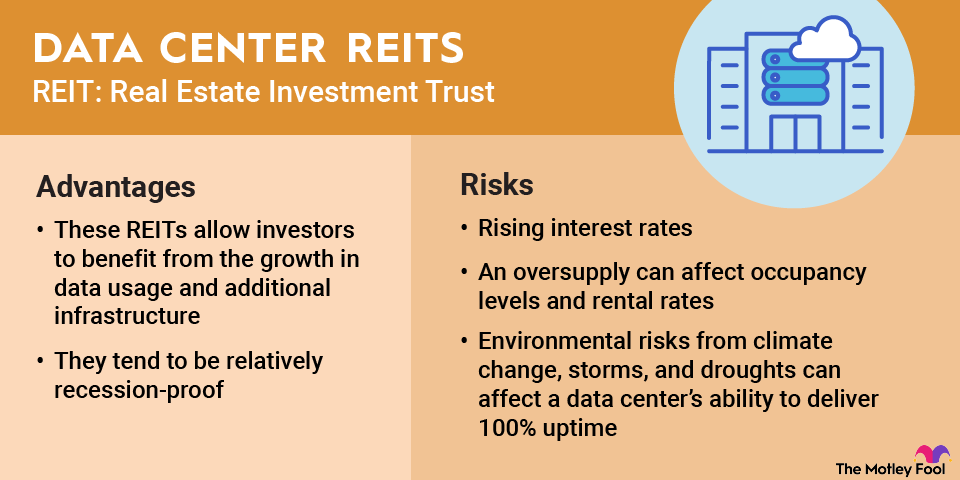
Equinix operates as a Real Estate Investment Trust (REIT), which is a specialized company that owns and manages income-producing real estate. Its platform creates a network effect where a high density of customers attracts more service providers and partners to the same locations.

A Look at the Numbers

  • Total revenue was $2.6 billion for the three months ended June 30, 2026, up 16% year over year.
  • Net income hit $477 million for the three months ended June 30, 2026, up 30% year over year.
  • Adjusted EBITDA, a non-GAAP metric, reached $2.6 billion for the six months ended June 30, 2026, up 20% year over year.
  • The company held $2.2 billion in cash, cash equivalents, and short-term investments as of June 30, 2026.

Bottom Line

Equinix has evolved from a basic data center provider into a global interconnection platform supporting cloud and artificial intelligence needs. Its focus on recurring revenue and strategic joint ventures provides a steady foundation for continued digital infrastructure expansion.

AI Generated • Aug 4, 2026

Industry

Specialized REITs

Employees

13,716

CEO

Adaire Fox-Martin

Headquarters

Redwood City, CA 94065-1562, US

EQIX Financials

Key Financial Metrics (TTM)

Gross Margin

51.60%

Operating Margin

21.76%

Net Income Margin

15.60%

Return on Equity

10.76%

Return on Capital

5.01%

Return on Assets

3.73%

Earnings Yield

1.42%

Dividend Yield

1.79%

Payout Ratio

1.28%

Stock Overview

Market Cap

$108.30BMarket cap calculated using publicly traded shares outstanding only. Does not include unlisted, private, or dual-class non-traded shares. Implied market cap may vary.

Shares Outstanding

98.67M

Volume

418.04K

Avg. Volume

607.78K

Financials (TTM)

Gross Profit

$5.07B

Operating Income

$2.14B

EBITDA

$4.49B

Operating Cash Flow

$3.94B

Capital Expenditure

-$2.57B

Free Cash Flow

$1.37B

Cash & ST Invst.

$2.22B

Total Debt

$23.36B

Equinix Performance Analysis

Equinix annual revenue and year-over-year revenue growth by fiscal year
Fiscal yearPeriod endRevenueYoY growth
20222022-12-31USD 7,264,657,0009.4%
20232023-12-31USD 8,188,136,00012.7%
20242024-12-31USD 8,748,000,0006.8%
20252025-12-31USD 9,217,000,0005.4%
Equinix sequential (quarter-over-quarter) revenue growth by fiscal quarter
Fiscal quarterPeriod endQoQ growth
Q32025-09-302.7%
Q42025-12-315.4%
Q12026-03-310.1%
Q22026-06-307.4%
Equinix annual diluted earnings per share and year-over-year EPS growth by fiscal year
Fiscal yearPeriod endDiluted EPSYoY growth
20222022-12-31USD 7.6738.6%
20232023-12-31USD 10.3134.4%
20242024-12-31USD 8.50-17.5%
20252025-12-31USD 13.7661.8%
Equinix sequential (quarter-over-quarter) diluted earnings per share growth by fiscal quarter
Fiscal quarterPeriod endQoQ growth
Q32025-09-301.6%
Q42025-12-31-29.4%
Q12026-03-3156.1%
Q22026-06-3015.0%

Revenue Growth Rate

Annual and quarterly growth comparison

Earnings Per Share Growth Rate

Annual and quarterly EPS growth comparison

Quarterly Performance

Name
Q2 2026YOY CHG

Revenue

$2.63B

+16.4%

Gross Profit

$1.40B

+19.0%

Gross Margin

53.14%

N/A

Market Cap

$108.30BMarket cap calculated using publicly traded shares outstanding only. Does not include unlisted, private, or dual-class non-traded shares. Implied market cap may vary.

N/A

Market Cap/Employee

$7.90M

N/A

Employees

13,716

N/A

Net Income

$479.00M

+30.2%

EBITDA

$1.23B

+18.5%

Quarterly Fundamentals

Name
Q2 2026YOY CHG

Total Cash

$2.22B

-50.9%

Total Debt

$23.36B

+6.9%

Accounts Receivable

$1.26B

+10.5%

Inventory

$0.00

N/A

Long Term Debt

$21.85B

+11.6%

Short Term Debt

$1.51B

-33.8%

Return on Assets

3.73%

N/A

Return on Invested Capital

5.74%

N/A

Free Cash Flow

$2.32B

+5262.2%

Operating Cash Flow

$1.07B

+13.0%

Other Investments to Explore

People Also Watch

Symbol / CompanyPricePrice Chg
PLDPrologis, Inc.
$140.02-0.43%
AMTAmerican Tower Corporation
$172.33+0.06%
DLRDigital Realty Trust, Inc.
$195.25-1.34%
SPGSimon Property Group, Inc.
$220.61-0.48%

Trending Stocks

Symbol / CompanyPricePrice Chg
TSLLDirexion Shares ETF Trust - Direxion Daily Tsla Bull 2x ETF
$8.48-0.02%
INTCIntel
$96.69-0.07%
NOKNokia
$10.39-0.04%
NVDANvidia
$219.74-0.02%

Questions About EQIX

What is the current price of Equinix?

Equinix is trading at $1,085.09 per share.

What is the 52-week range for Equinix?

Over the past 52 weeks, Equinix has traded between $720.62 and $1,128.68.

How much debt does Equinix have?

As of the most recent reporting period, Equinix reported total debt of $23.36B.

How much cash does Equinix have on hand?

Equinix reported $980.00M in cash and cash equivalents in its most recent financial results.

What is Equinix’s dividend yield?

Equinix currently has a dividend yield of 1.79%.

Premium Investing Services

Invest better with The Motley Fool. Get stock recommendations, portfolio guidance, and more from The Motley Fool's premium services.