
Iridium Communications
(NASDAQ) IRDM
Iridium Communications Financials at a Glance
Market Cap
$4.42B
Revenue (TTM)
$875.84M
Net Income (TTM)
$105.55M
EPS (TTM)
$0.99
P/E Ratio
42.20
Dividend
$0.60
Beta (Volatility)
0.91 (Low)
Dividend
$0.60
Beta (Volatility)
0.91 (Low)
Price
$43.55
Volume
3,822,583
Open
$41.52
Price
$43.55
Volume
3,822,583
Open
$41.52
Previous Close
$43.52
Daily Range
$41.39 - $44.12
52-Week Range
$15.65 - $53.83
Estimated Earnings Date
Jul 23, 2026
Dividend
$0.60
Beta (Volatility)
0.91 (Low)
Price
$43.55
Volume
3,822,583
Open
$41.52
Previous Close
$43.52
Daily Range
$41.39 - $44.12
52-Week Range
$15.65 - $53.83
Estimated Earnings Date
Jul 23, 2026
IRDM News


IRDM: Motley Fool Moneyball Superscore
Our CEO Is Handing Members His Secret Weapon
It's called Motley Fool Moneyball, our new proprietary AI tool
We spent over half a million dollars in R&D to build a tool that makes stock research faster, sharper, and smarter. Our analysts use it every day, and now, you can too.
Get Access NowAbout Iridium Communications
Industry
Diversified Telecommunication Services
Sector
Communication ServicesEmployees
975
CEO
Matthew J. Desch, MBA
Website
www.iridium.comHeadquarters
McLean, VA 22102, US
IRDM Financials
Key Financial Metrics (TTM)
Gross Margin
62.53%
Operating Margin
25.84%
Net Income Margin
12.05%
Return on Equity
22.76%
Return on Capital
10.61%
Return on Assets
4.17%
Earnings Yield
2.37%
Dividend Yield
1.43%
Payout Ratio
60.36%
Stock Overview
Market Cap
$4.42B
Shares Outstanding
105.73M
Volume
3.82M
Avg. Volume
2.55M
Financials (TTM)
Gross Profit
$547.64M
Operating Income
$226.31M
EBITDA
$440.20M
Operating Cash Flow
$410.61M
Capital Expenditure
-$105.69M
Free Cash Flow
$304.92M
Cash & ST Invst.
$111.64M
Total Debt
$1.76B
Iridium Communications Performance Analysis
Revenue Growth Rate
Annual and quarterly growth comparisonEarnings Per Share Growth Rate
Annual and quarterly EPS growth comparisonQuarterly Performance
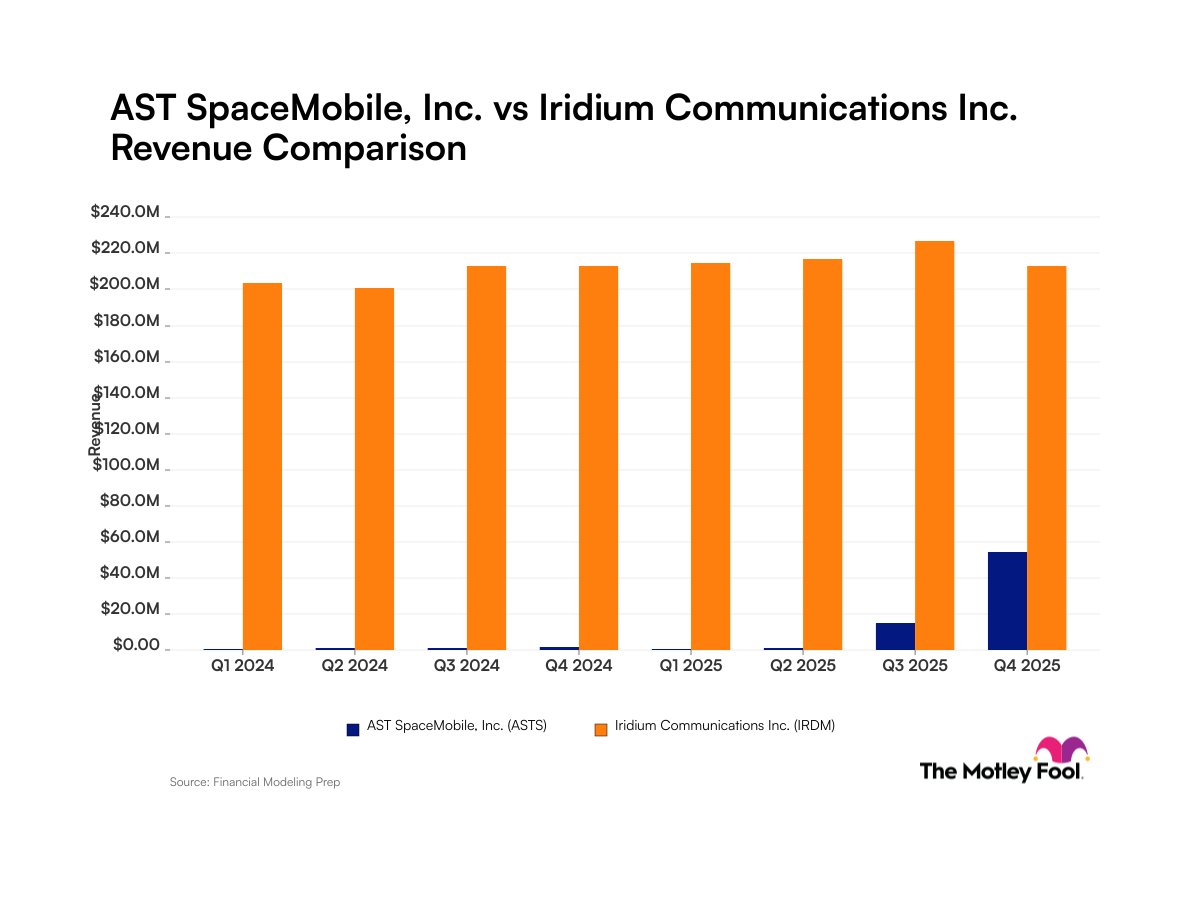
Revenue
$219.06M
+1.9%
Gross Profit
$169.42M
+66.8%
Gross Margin
77.34%
N/A
Market Cap
$4.42B
N/A
Market Cap/Employee
$5.07M
N/A
Employees
873
N/A
Net Income
$21.59M
-29.0%
EBITDA
$104.26M
-7.6%
Quarterly Fundamentals
Total Cash
$111.64M
+119.3%
Total Debt
$1.76B
-2.5%
Accounts Receivable
$104.38M
-1.0%
Inventory
$69.67M
-13.7%
Long Term Debt
$1.75B
-1.4%
Short Term Debt
$7.97M
-72.1%
Return on Assets
4.17%
N/A
Return on Invested Capital
9.34%
N/A
Free Cash Flow
$41.66M
+14.0%
Operating Cash Flow
$71.62M
+17.2%