Accessibility Menu
Goodyear Tire & Rubber logo

Goodyear Tire & Rubber(NASDAQ) GT

Market Cap$1.72BMarket cap calculated using publicly traded shares outstanding only. Does not include unlisted, private, or dual-class non-traded shares. Implied market cap may vary.
Since IPO (1968)+91%
5 Year-59%
1 Year-28%
1 Month-20%
Premium Feature
Moneyball Superscore
39/100
$5.99
+2.48%
+0.15Today
After hours$5.98-$0.01 (-0.17%)
Goodyear Tire & Rubber last closing stock price
MetricPriceDate
Last closeUSD 5.972026-08-21
Goodyear Tire & Rubber stock price return by period
PeriodPrice returnPrice at period startPeriod start date
1 week-2.29%USD 6.112026-08-14
1 month-19.87%USD 7.452026-07-22
3 month+1.36%USD 5.892026-05-22
Year to date-31.85%USD 8.762025-12-31
1 year-27.64%USD 8.252025-08-21
3 year-53.25%USD 12.772023-08-22
5 year-58.74%USD 14.472021-08-20
Since inception+91.07%USD 3.121968-01-02

Goodyear Tire & Rubber Financials at a Glance

Market Cap

$1.72BMarket cap calculated using publicly traded shares outstanding only. Does not include unlisted, private, or dual-class non-traded shares. Implied market cap may vary.

Revenue (TTM)

$17.69B

Net Income (TTM)

-$2.54B

EPS (TTM)

-$8.83

P/E Ratio

-0.68

Dividend

$0.00

Beta (Volatility)

1.49 (Average)

Price

$5.99

Volume

5,836,726

Open

$5.87

Previous Close

$5.97

Daily Range

$5.86 - $6.00

52-Week Range

$5.43 - $10.62

Estimated Earnings Date

Nov 2, 2026

GT: Motley Fool Moneyball Superscore

39

Our CEO Is Handing Members His Secret Weapon

It's called Motley Fool Moneyball, our new proprietary AI tool

We spent over half a million dollars in R&D to build a tool that makes stock research faster, sharper, and smarter. Our analysts use it every day, and now, you can too.

Get Access Now

About Goodyear Tire & Rubber

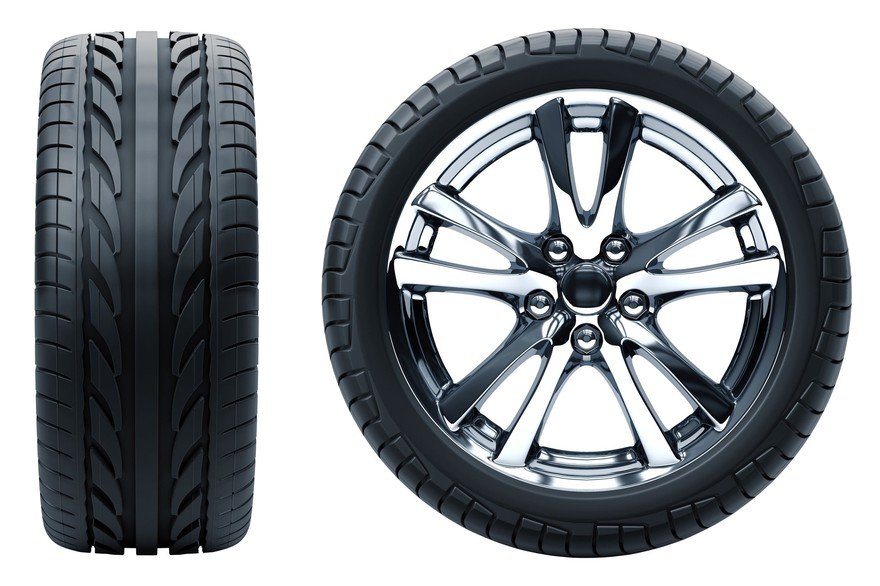
The Goodyear Tire & Rubber Company makes tires for cars and trucks. These tires help people travel safely on roads every day. The company also repairs vehicles at its many service centers.

What's in the Shop?

  • Americas Tires: Tire sales and services in North and Latin America; generated $4,445 million in net sales during the first six months of 2026.
  • EMEA Tires: Products for Europe, the Middle East, and Africa; recorded $2,735 million in net sales for the first six months of 2026.
  • Asia Pacific Tires: Tires and services for the Asia Pacific region; accounted for $951 million in net sales for the first six months of 2026.
  • Tire Retreading: Services for refreshing used tires for trucks and aircraft; includes manufacturing tread rubber and other essential materials.
  • Vehicle Services: Maintenance and repair work for cars and commercial fleets; delivered through roughly 1,000 retail locations worldwide.

Streamlining the Business

  • Launched the Goodyear Forward transformation plan to reduce costs and improve profitability.
  • Completed the sale of the Dunlop brand and the off-the-road tire business in 2025.
  • Divested its chemical business to focus on primary tire manufacturing and sales.
  • Approved a plan in July 2026 to close the tire manufacturing facility in Fayetteville, North Carolina.

Global Reach and Service

Goodyear operates a global manufacturing network with 48 facilities located across 19 countries. The company reaches customers through a network of independent dealers, regional distributors, and its own retail stores.

Checking the Books

  • Net sales were $4,250 million in the second quarter of 2026, down 4.8% year over year.
  • Goodyear recorded a net loss of $204 million for the second quarter of 2026.
  • Total segment operating income hit $131 million in the first six months of 2026, down 63.0% year over year.
  • Cash and cash equivalents totaled $861 million as of June 30, 2026.

Bottom Line

Goodyear is evolving from a broad industrial manufacturer into a leaner business focused on its primary tire brands. Its restructuring efforts aim to improve operational efficiency while adapting to shifting global markets.

AI Generated • Aug 7, 2026

Industry

Auto Components

Employees

63,000

CEO

Mark W. Stewart, MBA

Headquarters

Akron, OH 44316-0001, US

GT Financials

Key Financial Metrics (TTM)

Gross Margin

18.34%

Operating Margin

2.14%

Net Income Margin

-14.37%

Return on Equity

-84.20%

Return on Capital

6.22%

Return on Assets

-13.64%

Earnings Yield

-1.47%

Dividend Yield

0.00%

Payout Ratio

0.00%

Stock Overview

Market Cap

$1.72BMarket cap calculated using publicly traded shares outstanding only. Does not include unlisted, private, or dual-class non-traded shares. Implied market cap may vary.

Shares Outstanding

287.90M

Volume

5.84M

Avg. Volume

9.77M

Financials (TTM)

Gross Profit

$3.25B

Operating Income

$378.00M

EBITDA

$249.00M

Operating Cash Flow

$894.00M

Capital Expenditure

-$702.00M

Free Cash Flow

$192.00M

Cash & ST Invst.

$861.00M

Total Debt

$7.85B

Goodyear Tire & Rubber Performance Analysis

Goodyear Tire & Rubber annual revenue and year-over-year revenue growth by fiscal year
Fiscal yearPeriod endRevenueYoY growth
20222022-12-31USD 20,805,000,00019.0%
20232023-12-31USD 20,066,000,000-3.6%
20242024-12-31USD 18,878,000,000-5.9%
20252025-12-31USD 18,280,000,000-3.2%
Goodyear Tire & Rubber sequential (quarter-over-quarter) revenue growth by fiscal quarter
Fiscal quarterPeriod endQoQ growth
Q32025-09-304.0%
Q42025-12-315.9%
Q12026-03-31-21.1%
Q22026-06-309.5%
Goodyear Tire & Rubber annual diluted earnings per share and year-over-year EPS growth by fiscal year
Fiscal yearPeriod endDiluted EPSYoY growth
20222022-12-31USD 0.71-75.6%
20232023-12-31USD -2.42N/A
20242024-12-31USD 0.16N/A
20252025-12-31USD -5.98N/A
Goodyear Tire & Rubber sequential (quarter-over-quarter) diluted earnings per share growth by fiscal quarter
Fiscal quarterPeriod endQoQ growth
Q32025-09-30-965.9%
Q42025-12-31104.7%
Q12026-03-31-338.9%
Q22026-06-3017.4%

Revenue Growth Rate

Annual and quarterly growth comparison

Earnings Per Share Growth Rate

Annual and quarterly EPS growth comparison

Quarterly Performance

Name
Q2 2026YOY CHG

Revenue

$4.25B

-4.8%

Gross Profit

$681.00M

-10.4%

Gross Margin

16.02%

N/A

Market Cap

$1.72BMarket cap calculated using publicly traded shares outstanding only. Does not include unlisted, private, or dual-class non-traded shares. Implied market cap may vary.

N/A

Market Cap/Employee

$27.28K

N/A

Employees

63,000

N/A

Net Income

-$204.00M

-180.3%

EBITDA

-$46.00M

-106.7%

Quarterly Fundamentals

Name
Q2 2026YOY CHG

Total Cash

$861.00M

+9.7%

Total Debt

$7.85B

-12.5%

Accounts Receivable

$2.73B

-8.9%

Inventory

$3.92B

-2.8%

Long Term Debt

$6.60B

-11.9%

Short Term Debt

$1.25B

-15.9%

Return on Assets

-13.64%

N/A

Return on Invested Capital

3.32%

N/A

Free Cash Flow

-$69.00M

+82.2%

Operating Cash Flow

$98.00M

+154.4%

Other Investments to Explore

People Also Watch

Symbol / CompanyPricePrice Chg
ADNTAdient plc
$20.01+2.67%
BLBDBlue Bird Corporation
$61.89+0.91%
CCSCentury Communities, Inc.
$69.78+0.46%
KSSKohl's Corporation
$17.59+1.50%

Trending Stocks

Symbol / CompanyPricePrice Chg
TSLLDirexion Shares ETF Trust - Direxion Daily Tsla Bull 2x ETF
$9.77+0.10%
IBITiShares Bitcoin Trust
$43.68+0.06%
BITOProShares Trust - ProShares Bitcoin ETF
$10.41+0.06%
MARAMara Holdings
$11.26+0.01%

Questions About GT

What is the current price of Goodyear Tire & Rubber?

Goodyear Tire & Rubber is trading at $5.97 per share.

What is the 52-week range for Goodyear Tire & Rubber?

Over the past 52 weeks, Goodyear Tire & Rubber has traded between $5.43 and $10.62.

How much debt does Goodyear Tire & Rubber have?

As of the most recent reporting period, Goodyear Tire & Rubber reported total debt of $8.21B.

How much cash does Goodyear Tire & Rubber have on hand?

Goodyear Tire & Rubber reported $965.00M in cash and cash equivalents in its most recent financial results.

What is Goodyear Tire & Rubber’s dividend yield?

Goodyear Tire & Rubber does not currently have a dividend yield.

Premium Investing Services

Invest better with The Motley Fool. Get stock recommendations, portfolio guidance, and more from The Motley Fool's premium services.