Accessibility Menu
Accel Entertainment logo

Accel Entertainment(NYSE) ACEL

Market Cap$945.09MMarket cap calculated using publicly traded shares outstanding only. Does not include unlisted, private, or dual-class non-traded shares. Implied market cap may vary.
Since IPO (2019)+6%
5 Year+1%
1 Year+0%
1 Month-3%
Premium Feature
Moneyball Superscore
67/100
$11.55
-0.77%
-0.09Today
Accel Entertainment last closing stock price
MetricPriceDate
Last closeUSD 11.642026-08-31
Accel Entertainment stock price return by period
PeriodPrice returnPrice at period startPeriod start date
1 week-2.76%USD 11.972026-08-24
1 month-3.16%USD 12.022026-07-31
3 month-3%USD 12.002026-06-02
Year to date+2.02%USD 11.412025-12-31
1 year+0.43%USD 11.592025-08-29
3 year-1.94%USD 11.872023-09-01
5 year+1.04%USD 11.522021-09-01
Since inception+6.3%USD 10.952019-11-21

Accel Entertainment Financials at a Glance

Market Cap

$945.09MMarket cap calculated using publicly traded shares outstanding only. Does not include unlisted, private, or dual-class non-traded shares. Implied market cap may vary.

Revenue (TTM)

$1.39B

Net Income (TTM)

$56.68M

EPS (TTM)

$0.68

P/E Ratio

17.22

Dividend

$0.00

Beta (Volatility)

0.85 (Low)

Price

$11.55

Volume

97,991.27

Open

$11.62

Previous Close

$11.64

Daily Range

$11.47 - $11.65

52-Week Range

$9.55 - $14.00

Estimated Earnings Date

Nov 3, 2026

ACEL: Motley Fool Moneyball Superscore

67

Our CEO Is Handing Members His Secret Weapon

It's called Motley Fool Moneyball, our new proprietary AI tool

We spent over half a million dollars in R&D to build a tool that makes stock research faster, sharper, and smarter. Our analysts use it every day, and now, you can too.

Get Access Now

About Accel Entertainment

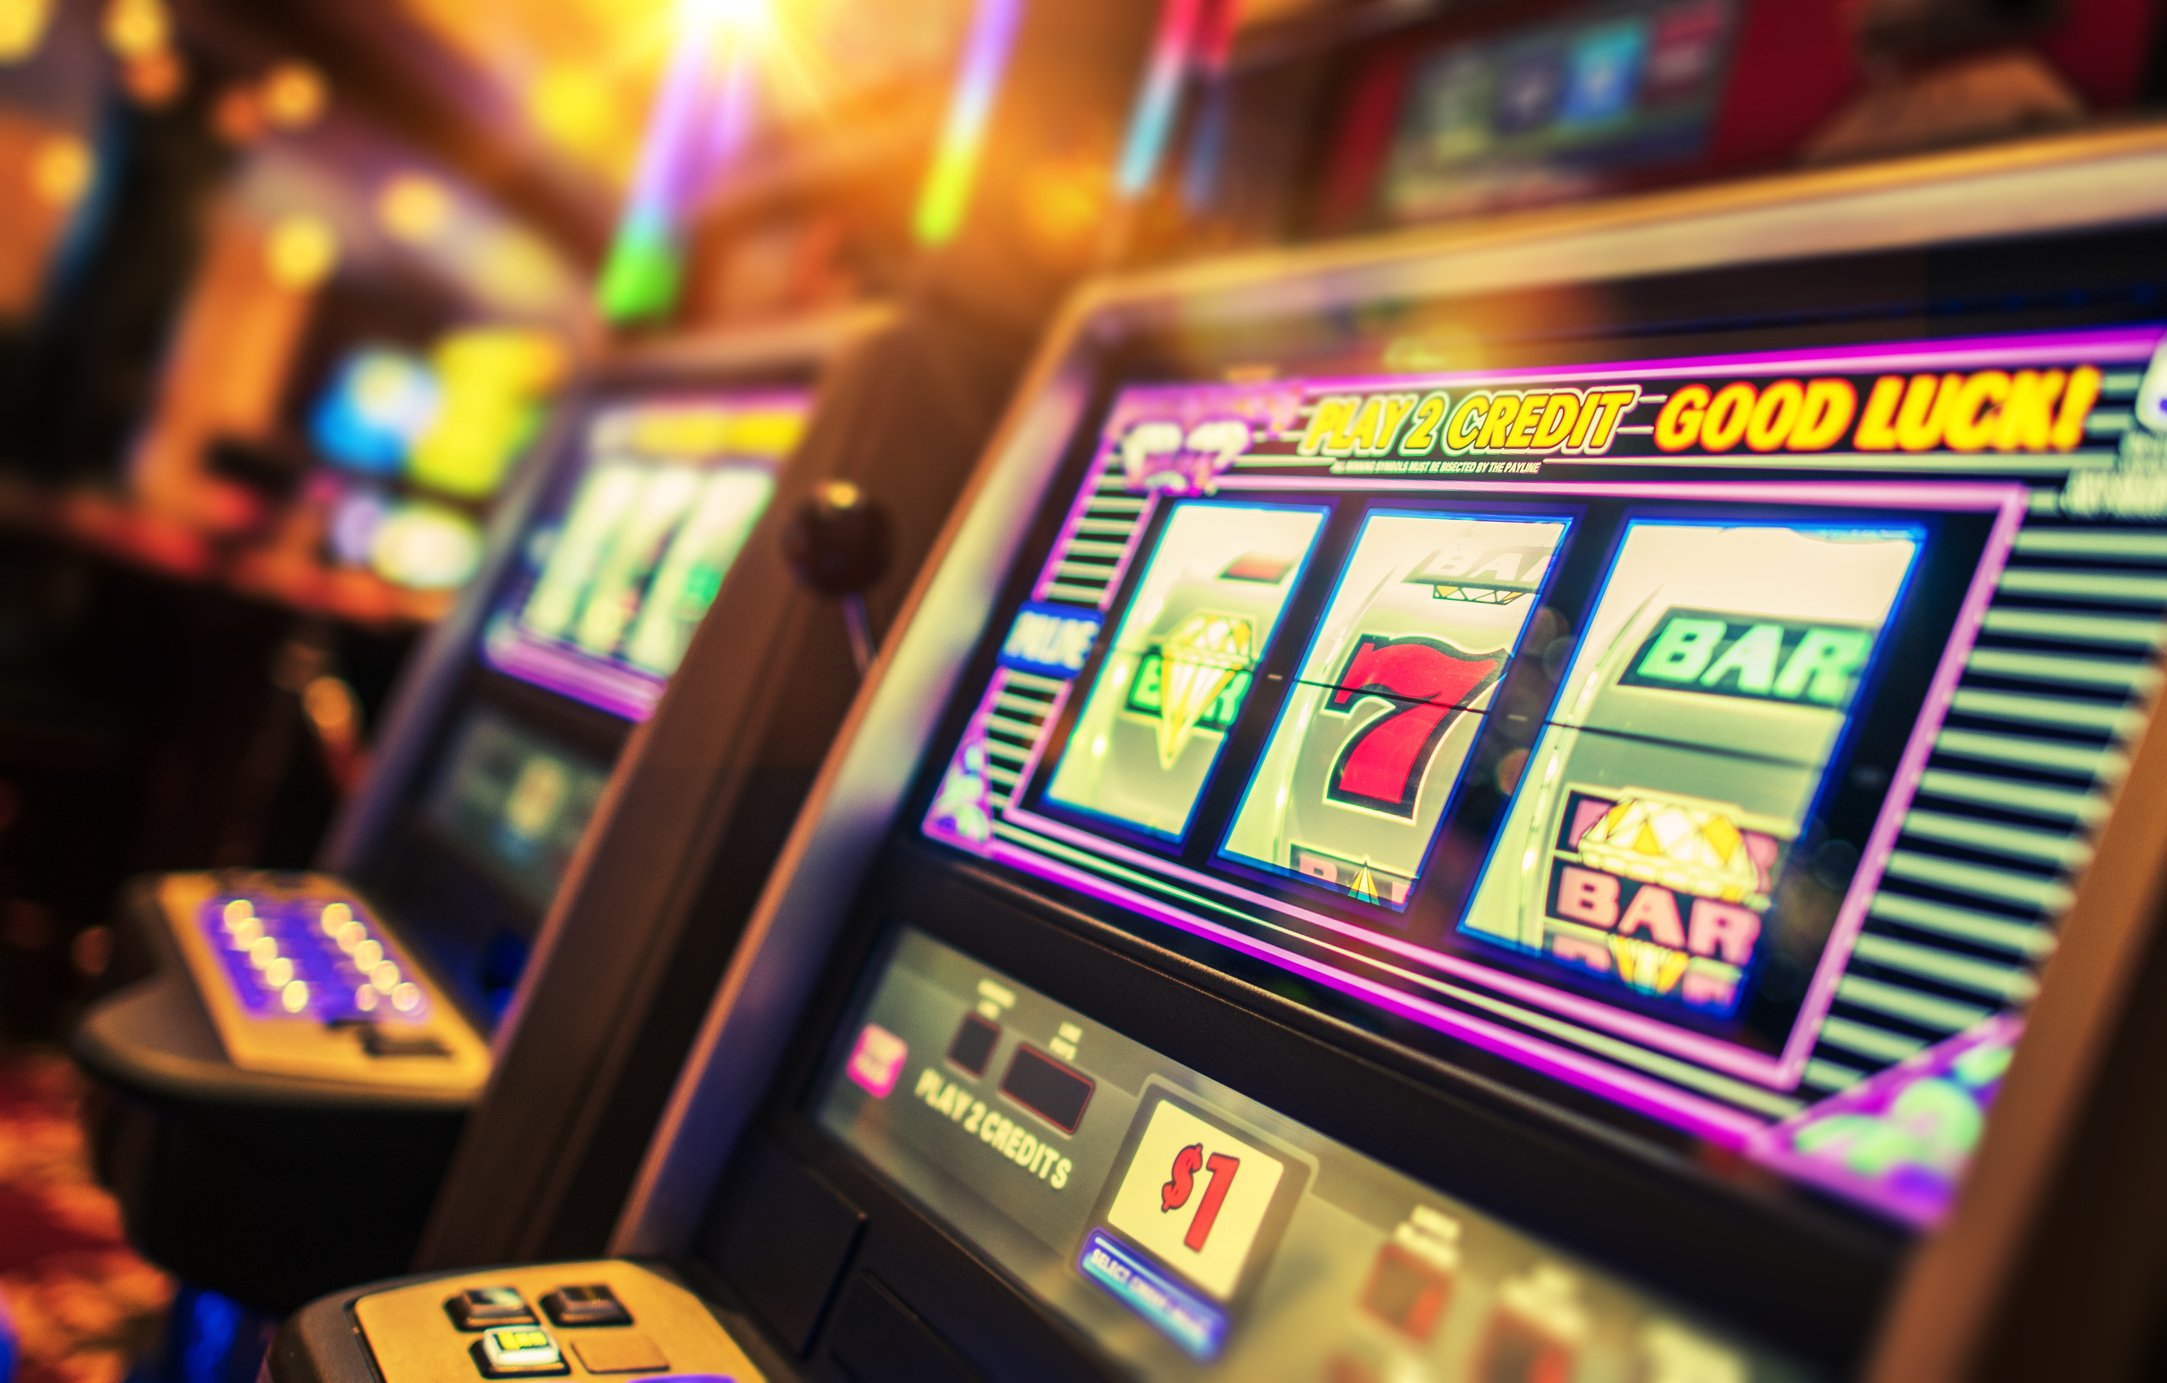
Accel Entertainment, Inc. puts gaming machines in local bars and restaurants. It helps small business owners add new ways to make money. The firm also operates a horse track and a casino.

Where the Money Comes From

  • Gaming Terminals: Video gaming machines installed and maintained in noncasino businesses like restaurants, taverns, and truck stops.
  • Amusement Devices: Equipment such as jukeboxes, pool tables, and dartboards that provide entertainment and lead generation.
  • Redemption and ATM Services: Devices that pay out prizes and offer standard automated teller machine functions.
  • Casino and Racing: Operations including a thoroughbred horse track and a casino with gaming tables and positions.
  • Manufacturing: Development and production of proprietary gaming terminals and software sold to other operators.

Expanding the Gaming Footprint

  • Expanded into Montana and Nevada in 2022 through the acquisition of Century Gaming.
  • Acquired Grand Vision Gaming in 2022 to design and manufacture its own gaming terminals.
  • Acquired 85% of Toucan Gaming in 2024 to enter the Louisiana market.
  • Acquired Fairmount Park in 2024 to operate horse racing and casino gaming in Illinois.

The Accel Advantage

Accel provides a turnkey solution that handles equipment installation and regulatory licensing for its partners. This approach allows local business owners to offer gaming without managing complex legal requirements themselves.

Tracking the Recent Performance

  • Total net revenues were $719.7 million for the six months ended June 30, 2026, up 9.1% year over year.
  • Net income reached $12.5 million for the three months ended June 30, 2026, up 72.2% year over year.
  • Adjusted EBITDA hit $112.7 million for the six months ended June 30, 2026, up 9.7% year over year.
  • Cash and cash equivalents totaled $255.5 million as of June 30, 2026.

Evolution of the Business

Accel has evolved from a local Illinois operator into a multistate provider of distributed gaming and casino entertainment. The business model combines recurring gaming revenue with equipment manufacturing and traditional racing operations.

AI Generated • Aug 5, 2026

Industry

Hotels, Restaurants and Leisure

Employees

1,600

CEO

Andrew H. Rubenstein

Headquarters

Burr Ridge, IL 60527, US

ACEL Financials

Key Financial Metrics (TTM)

Gross Margin

31.83%

Operating Margin

8.21%

Net Income Margin

4.08%

Return on Equity

20.74%

Return on Capital

12.09%

Return on Assets

5.17%

Earnings Yield

5.81%

Dividend Yield

0.00%

Payout Ratio

0.00%

Stock Overview

Market Cap

$945.09MMarket cap calculated using publicly traded shares outstanding only. Does not include unlisted, private, or dual-class non-traded shares. Implied market cap may vary.

Shares Outstanding

81.19M

Volume

97.99K

Avg. Volume

305.05K

Financials (TTM)

Gross Profit

$442.66M

Operating Income

$114.16M

EBITDA

$204.11M

Operating Cash Flow

$149.03M

Capital Expenditure

$18.84M

Free Cash Flow

$167.86M

Cash & ST Invst.

$255.45M

Total Debt

$573.33M

Accel Entertainment Performance Analysis

Accel Entertainment annual revenue and year-over-year revenue growth by fiscal year
Fiscal yearPeriod endRevenueYoY growth
20222022-12-31USD 969,797,00032.0%
20232023-12-31USD 1,170,420,00020.7%
20242024-12-31USD 1,230,972,0005.2%
20252025-12-31USD 1,330,960,0008.1%
Accel Entertainment sequential (quarter-over-quarter) revenue growth by fiscal quarter
Fiscal quarterPeriod endQoQ growth
Q32025-09-30-1.9%
Q42025-12-313.6%
Q12026-03-313.0%
Q22026-06-304.7%
Accel Entertainment annual diluted earnings per share and year-over-year EPS growth by fiscal year
Fiscal yearPeriod endDiluted EPSYoY growth
20222022-12-31USD 0.81143.6%
20232023-12-31USD 0.53-35.3%
20242024-12-31USD 0.41-21.1%
20252025-12-31USD 0.6043.7%
Accel Entertainment sequential (quarter-over-quarter) diluted earnings per share growth by fiscal quarter
Fiscal quarterPeriod endQoQ growth
Q32025-09-3090.2%
Q42025-12-3118.8%
Q12026-03-31-10.5%
Q22026-06-30-11.8%

Revenue Growth Rate

Annual and quarterly growth comparison

Earnings Per Share Growth Rate

Annual and quarterly EPS growth comparison

Quarterly Performance

Name
Q2 2026YOY CHG

Revenue

$368.13M

+9.6%

Gross Profit

$115.51M

+9.7%

Gross Margin

31.38%

N/A

Market Cap

$945.09MMarket cap calculated using publicly traded shares outstanding only. Does not include unlisted, private, or dual-class non-traded shares. Implied market cap may vary.

N/A

Market Cap/Employee

$590.68K

N/A

Employees

1,600

N/A

Net Income

$12.49M

+70.8%

EBITDA

$57.74M

+42.4%

Quarterly Fundamentals

Name
Q2 2026YOY CHG

Total Cash

$255.45M

-3.5%

Total Debt

$573.33M

-5.7%

Accounts Receivable

$41.01M

+248.6%

Inventory

$9.61M

-0.8%

Long Term Debt

$543.33M

-4.9%

Short Term Debt

$30.00M

-18.1%

Return on Assets

5.17%

N/A

Return on Invested Capital

11.82%

N/A

Free Cash Flow

$8.86M

+242.1%

Operating Cash Flow

$19.96M

+0.8%

Other Investments to Explore

People Also Watch

Symbol / CompanyPricePrice Chg
AEVAAeva Technologies, Inc.
$14.63-6.58%
LUXELuxExperience B.V.
$7.45-2.49%
ODPThe ODP Corporation
$28.00+0.04%
SMPStandard Motor Products, Inc.
$37.84+0.32%

Trending Stocks

Symbol / CompanyPricePrice Chg
TSLLDirexion Shares ETF Trust - Direxion Daily Tsla Bull 2x ETF
$9.29-0.07%
NVDANvidia
$217.44-0.02%
INTCIntel
$88.48-0.01%
NUNu Holdings
$14.48-0.01%

Questions About ACEL

What is the current price of Accel Entertainment?

Accel Entertainment is trading at $11.54 per share.

What is the 52-week range for Accel Entertainment?

Over the past 52 weeks, Accel Entertainment has traded between $9.55 and $14.00.

How much debt does Accel Entertainment have?

As of the most recent reporting period, Accel Entertainment reported total debt of $587.94M.

How much cash does Accel Entertainment have on hand?

Accel Entertainment reported $255.45M in cash and cash equivalents in its most recent financial results.

What is Accel Entertainment’s dividend yield?

Accel Entertainment does not currently have a dividend yield.

Premium Investing Services

Invest better with The Motley Fool. Get stock recommendations, portfolio guidance, and more from The Motley Fool's premium services.