Accenture Plc logo

Accenture Plc(NYSE) ACN

Market Cap$129.92BMarket cap calculated using publicly traded shares outstanding only. Does not include unlisted, private, or dual-class non-traded shares. Implied market cap may vary.
Since IPO (2001)+1,969%
5 Year-28%
1 Year-10%
1 Month+13%
Premium Feature
Moneyball Superscore
76/100
$199.16
-6.19%
-13.15Today
After hours$199.24+$0.09 (+0.04%)
Accenture Plc last closing stock price
MetricPriceDate
Last closeUSD 212.302026-10-01
Accenture Plc stock price return by period
PeriodPrice returnPrice at period startPeriod start date
1 week+19.67%USD 177.412026-09-24
1 month+12.87%USD 188.092026-09-01
3 month+56.43%USD 135.722026-07-02
Year to date-18.77%USD 261.362025-12-31
1 year-9.99%USD 235.872025-10-01
3 year-26.36%USD 288.292023-10-02
5 year-28.13%USD 295.392021-10-01
Since inception+1,968.76%USD 10.262001-07-19

Accenture Plc Financials at a Glance

Market Cap

$129.92BMarket cap calculated using publicly traded shares outstanding only. Does not include unlisted, private, or dual-class non-traded shares. Implied market cap may vary.

Revenue (TTM)

$74.18B

Net Income (TTM)

$8.44B

EPS (TTM)

$13.57

P/E Ratio

15.65

Dividend

$6.52

Beta (Volatility)

0.94 (Low)

Price

$199.16

Volume

10,035,767

Open

$211.02

Previous Close

$198.90

Daily Range

$198.36 - $213.31

52-Week Range

$118.15 - $291.09

Estimated Earnings Date

Dec 17, 2026

ACN: Motley Fool Moneyball Superscore

76

Our CEO Is Handing Members His Secret Weapon

It's called Motley Fool Moneyball, our new proprietary AI tool

We spent over half a million dollars in R&D to build a tool that makes stock research faster, sharper, and smarter. Our analysts use it every day, and now, you can too.

Get Access Now

About Accenture Plc

Accenture helps large companies use technology to run better. It shows businesses how to use artificial intelligence and the cloud. The firm also manages technical tasks for other organizations.

A Diverse Service Menu

  • Managed Services: Operations, application development, and cloud management; accounts for 50% of revenue.
  • Consulting Services: Strategy and digital transformation for clients; accounts for 50% of revenue.

Within these two main categories are several subcategories, including:

  • Products: Services for retail, travel, and life sciences; accounts for 30% of revenue.
  • Health and Public Service: Solutions for government and healthcare; accounts for 21% of revenue.
  • Financial Services: Support for banking and insurance; accounts for 19% of revenue.

Strategies for Scaling Up

  • Completed a six-month business optimization program in the first quarter of fiscal 2026 to reduce future operating costs.
  • Increased potential cash spending on business acquisitions to $9 billion for fiscal 2026, compared to a $5 billion target in the prior year.
  • Filed a registration statement for Accenture Capital and Accenture Global Capital DAC to issue future debt securities in 2024.
  • Expanded technical capabilities in artificial intelligence to help global enterprises build a digital core.

The Power of People

Accenture maintains a global workforce of 799,000 professionals as of May 31, 2026, to match specific skills with local client demands. The company utilizes proprietary platforms and deep industry expertise to deliver large-scale business transformations across three geographic markets.

Recent Numbers and Performance

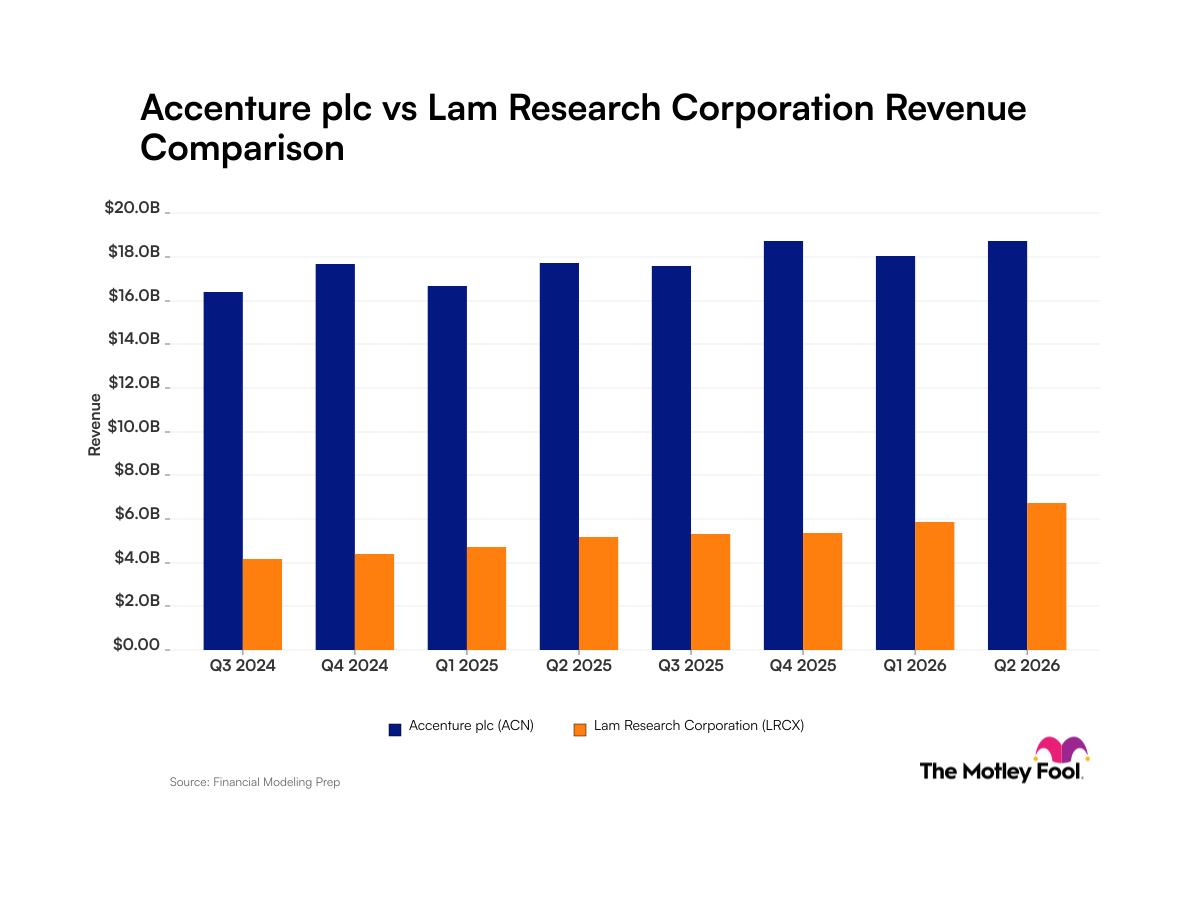
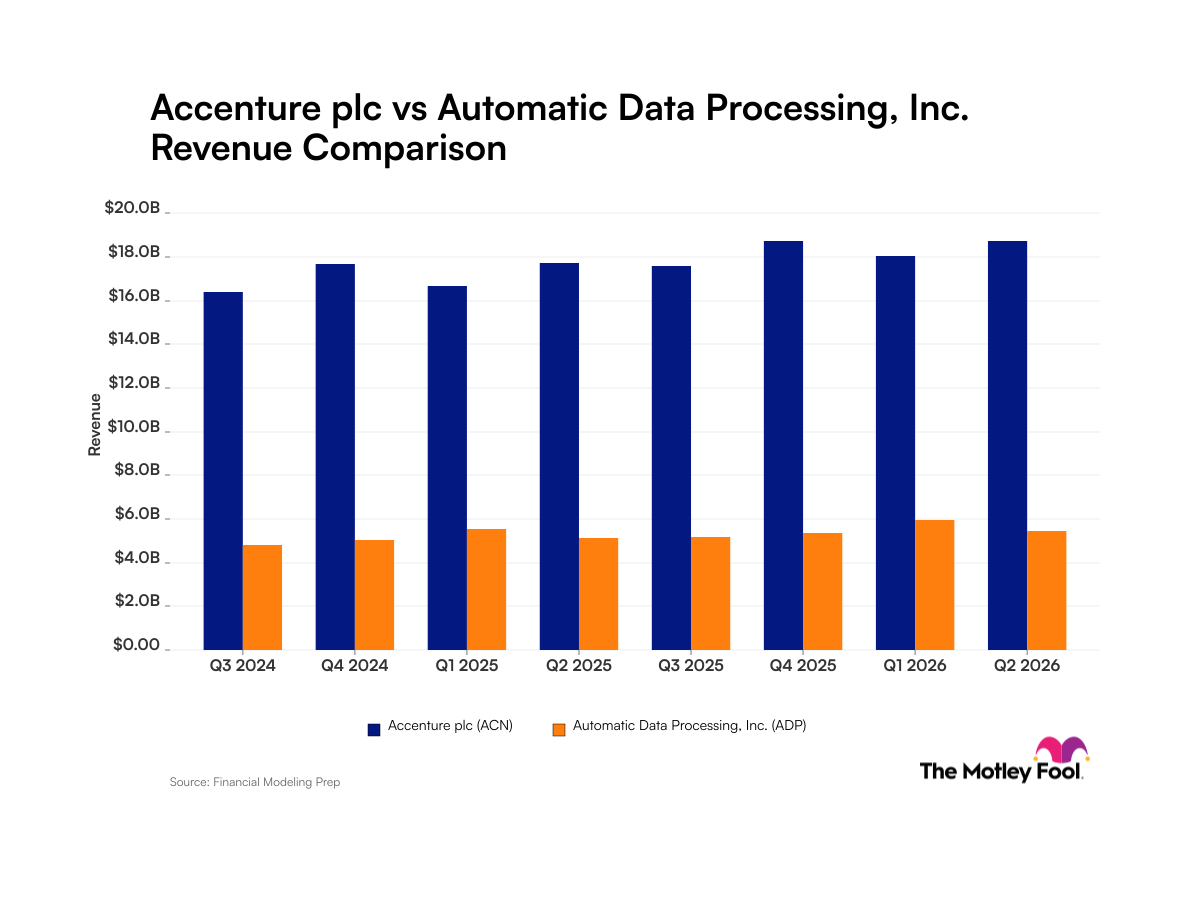
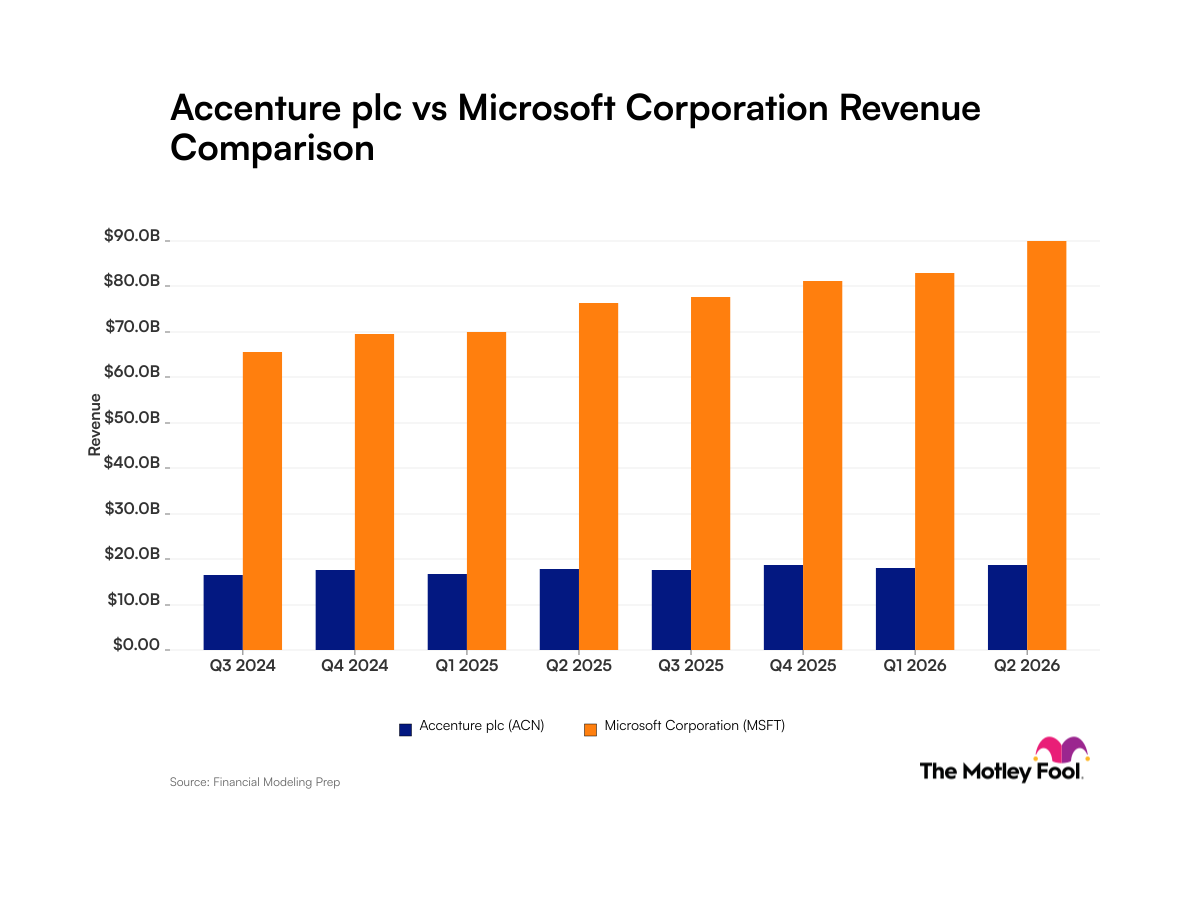
  • Revenue was $18.7 billion in the third quarter of fiscal 2026, up 6% year-over-year.
  • Operating margin was 17% in the third quarter of fiscal 2026, compared to 16.8% in the prior year.
  • Diluted earnings per share were $3.80 in the third quarter of fiscal 2026, up 9% year-over-year.
  • Cash and cash equivalents were $10.2 billion as of May 31, 2026, compared to $11.5 billion as of August 31, 2025.

Bottom Line

Accenture has transitioned from traditional consulting to a model focused on total enterprise reinvention through cloud and AI integration. This evolution allows the firm to manage complex operations for global clients while maintaining stable profit margins.

AI Generated • Jun 19, 2026

Industry

IT Services

Employees

779,000

CEO

Julie Spellman Sweet

Headquarters

Dublin, DU D02 P820, IE

ACN Financials

Key Financial Metrics (TTM)

Gross Margin

32.01%

Operating Margin

15.38%

Net Income Margin

11.38%

Return on Equity

26.90%

Return on Capital

26.87%

Return on Assets

11.47%

Earnings Yield

6.39%

Dividend Yield

3.07%

Payout Ratio

47.20%

Stock Overview

Market Cap

$129.92BMarket cap calculated using publicly traded shares outstanding only. Does not include unlisted, private, or dual-class non-traded shares. Implied market cap may vary.

Shares Outstanding

611.94M

Volume

10.04M

Avg. Volume

6.66M

Financials (TTM)

Gross Profit

$23.75B

Operating Income

$11.41B

EBITDA

$12.64B

Operating Cash Flow

$12.36B

Capital Expenditure

-$742.75M

Free Cash Flow

$11.62B

Cash & ST Invst.

$12.84B

Total Debt

$10.88B

Accenture Plc Performance Analysis

Accenture Plc annual revenue and year-over-year revenue growth by fiscal year
Fiscal yearPeriod endRevenueYoY growth
20232023-08-31USD 64,111,745,0004.1%
20242024-08-31USD 64,896,464,0001.2%
20252025-08-31USD 69,672,977,0007.4%
20262026-08-31USD 74,183,445,0006.5%
Accenture Plc sequential (quarter-over-quarter) revenue growth by fiscal quarter
Fiscal quarterPeriod endQoQ growth
Q12025-11-306.5%
Q22026-02-28-3.7%
Q32026-05-313.7%
Q42026-08-31-0.2%
Accenture Plc annual diluted earnings per share and year-over-year EPS growth by fiscal year
Fiscal yearPeriod endDiluted EPSYoY growth
20232023-08-31USD 10.770.6%
20242024-08-31USD 11.446.2%
20252025-08-31USD 12.156.3%
20262026-08-31USD 13.5611.6%
Accenture Plc sequential (quarter-over-quarter) diluted earnings per share growth by fiscal quarter
Fiscal quarterPeriod endQoQ growth
Q12025-11-3057.3%
Q22026-02-28-17.2%
Q32026-05-3129.7%
Q42026-08-31-13.4%

Revenue Growth Rate

Annual and quarterly growth comparison

Earnings Per Share Growth Rate

Annual and quarterly EPS growth comparison

Quarterly Performance

Name
Q4 2026YOY CHG

Revenue

$18.68B

+6.2%

Gross Profit

$5.98B

+6.7%

Gross Margin

32.04%

N/A

Market Cap

$129.92BMarket cap calculated using publicly traded shares outstanding only. Does not include unlisted, private, or dual-class non-traded shares. Implied market cap may vary.

N/A

Market Cap/Employee

$162.60K

N/A

Employees

799,000

N/A

Net Income

$2.03B

+43.8%

EBITDA

$2.86B

-1.3%

Quarterly Fundamentals

Name
Q4 2026YOY CHG

Total Cash

$12.84B

+11.8%

Total Debt

$10.88B

+33.0%

Accounts Receivable

$327.24M

-97.8%

Inventory

$0.00

N/A

Long Term Debt

$10.00B

+36.2%

Short Term Debt

$881.44M

+4.5%

Return on Assets

11.47%

N/A

Return on Invested Capital

22.24%

N/A

Free Cash Flow

$2.85B

-25.3%

Operating Cash Flow

$3.10B

-20.9%

Other Investments to Explore

People Also Watch

Symbol / CompanyPricePrice Chg
SONYSony Group Corporation
$23.82+1.41%
ADBEAdobe Inc.
$237.69-1.49%
QCOMQUALCOMM Incorporated
$184.87+1.53%
APHAmphenol Corporation
$86.96+1.51%

Trending Stocks

Symbol / CompanyPricePrice Chg
NKENike
$33.87-3.64%
NVDANvidia
$233.95+1.34%
SPCXSpace Exploration Technologies
$158.96+7.36%
SOXSDirexion Shares ETF Trust - Direxion Daily Semiconductor Bear 3x ETF
$29.71-6.46%

Questions About ACN

What is the current price of Accenture Plc?

Accenture Plc is trading at $198.90 per share.

What is the 52-week range for Accenture Plc?

Over the past 52 weeks, Accenture Plc has traded between $118.15 and $291.09.

How much debt does Accenture Plc have?

As of the most recent reporting period, Accenture Plc reported total debt of $13.40B.

How much cash does Accenture Plc have on hand?

Accenture Plc reported $12.83B in cash and cash equivalents in its most recent financial results.

What is Accenture Plc’s dividend yield?

Accenture Plc currently has a dividend yield of 3.07%.

Premium Investing Services

Invest better with The Motley Fool. Get stock recommendations, portfolio guidance, and more from The Motley Fool's premium services.