Accessibility Menu
Hyster-Yale logo

Hyster-Yale(NYSE) HY

Market Cap$590.45MMarket cap calculated using publicly traded shares outstanding only. Does not include unlisted, private, or dual-class non-traded shares. Implied market cap may vary.
Since IPO (2012)+12%
5 Year-33%
1 Year-6%
1 Month+0%
Premium Feature
Moneyball Superscore
45/100
$34.77
+5.59%
+1.84Today
Hyster-Yale last closing stock price
MetricPriceDate
Last closeUSD 32.932026-08-20
Hyster-Yale stock price return by period
PeriodPrice returnPrice at period startPeriod start date
1 week-4.25%USD 34.392026-08-13
1 month+0.4%USD 32.802026-07-21
3 month-1.82%USD 33.542026-05-22
Year to date+13.03%USD 29.132025-12-31
1 year-6.3%USD 35.142025-08-20
3 year-18.75%USD 40.532023-08-21
5 year-33.01%USD 49.162021-08-20
Since inception+11.98%USD 29.412012-09-28

Hyster-Yale Financials at a Glance

Market Cap

$590.45MMarket cap calculated using publicly traded shares outstanding only. Does not include unlisted, private, or dual-class non-traded shares. Implied market cap may vary.

Revenue (TTM)

$3.51B

Net Income (TTM)

-$116.70M

EPS (TTM)

-$6.57

P/E Ratio

-5.01

Dividend

$1.45

Beta (Volatility)

1.17 (Average)

Price

$34.77

Volume

73,399.25

Open

$33.37

Previous Close

$32.93

Daily Range

$33.25 - $34.82

52-Week Range

$26.41 - $41.30

Estimated Earnings Date

Nov 3, 2026

HY: Motley Fool Moneyball Superscore

45

Our CEO Is Handing Members His Secret Weapon

It's called Motley Fool Moneyball, our new proprietary AI tool

We spent over half a million dollars in R&D to build a tool that makes stock research faster, sharper, and smarter. Our analysts use it every day, and now, you can too.

Get Access Now

About Hyster-Yale

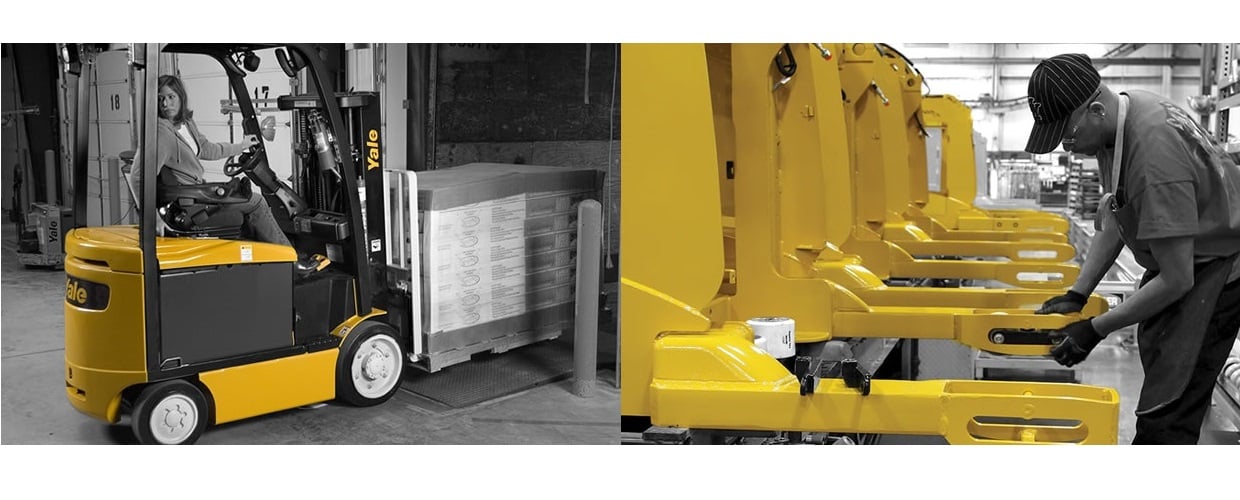
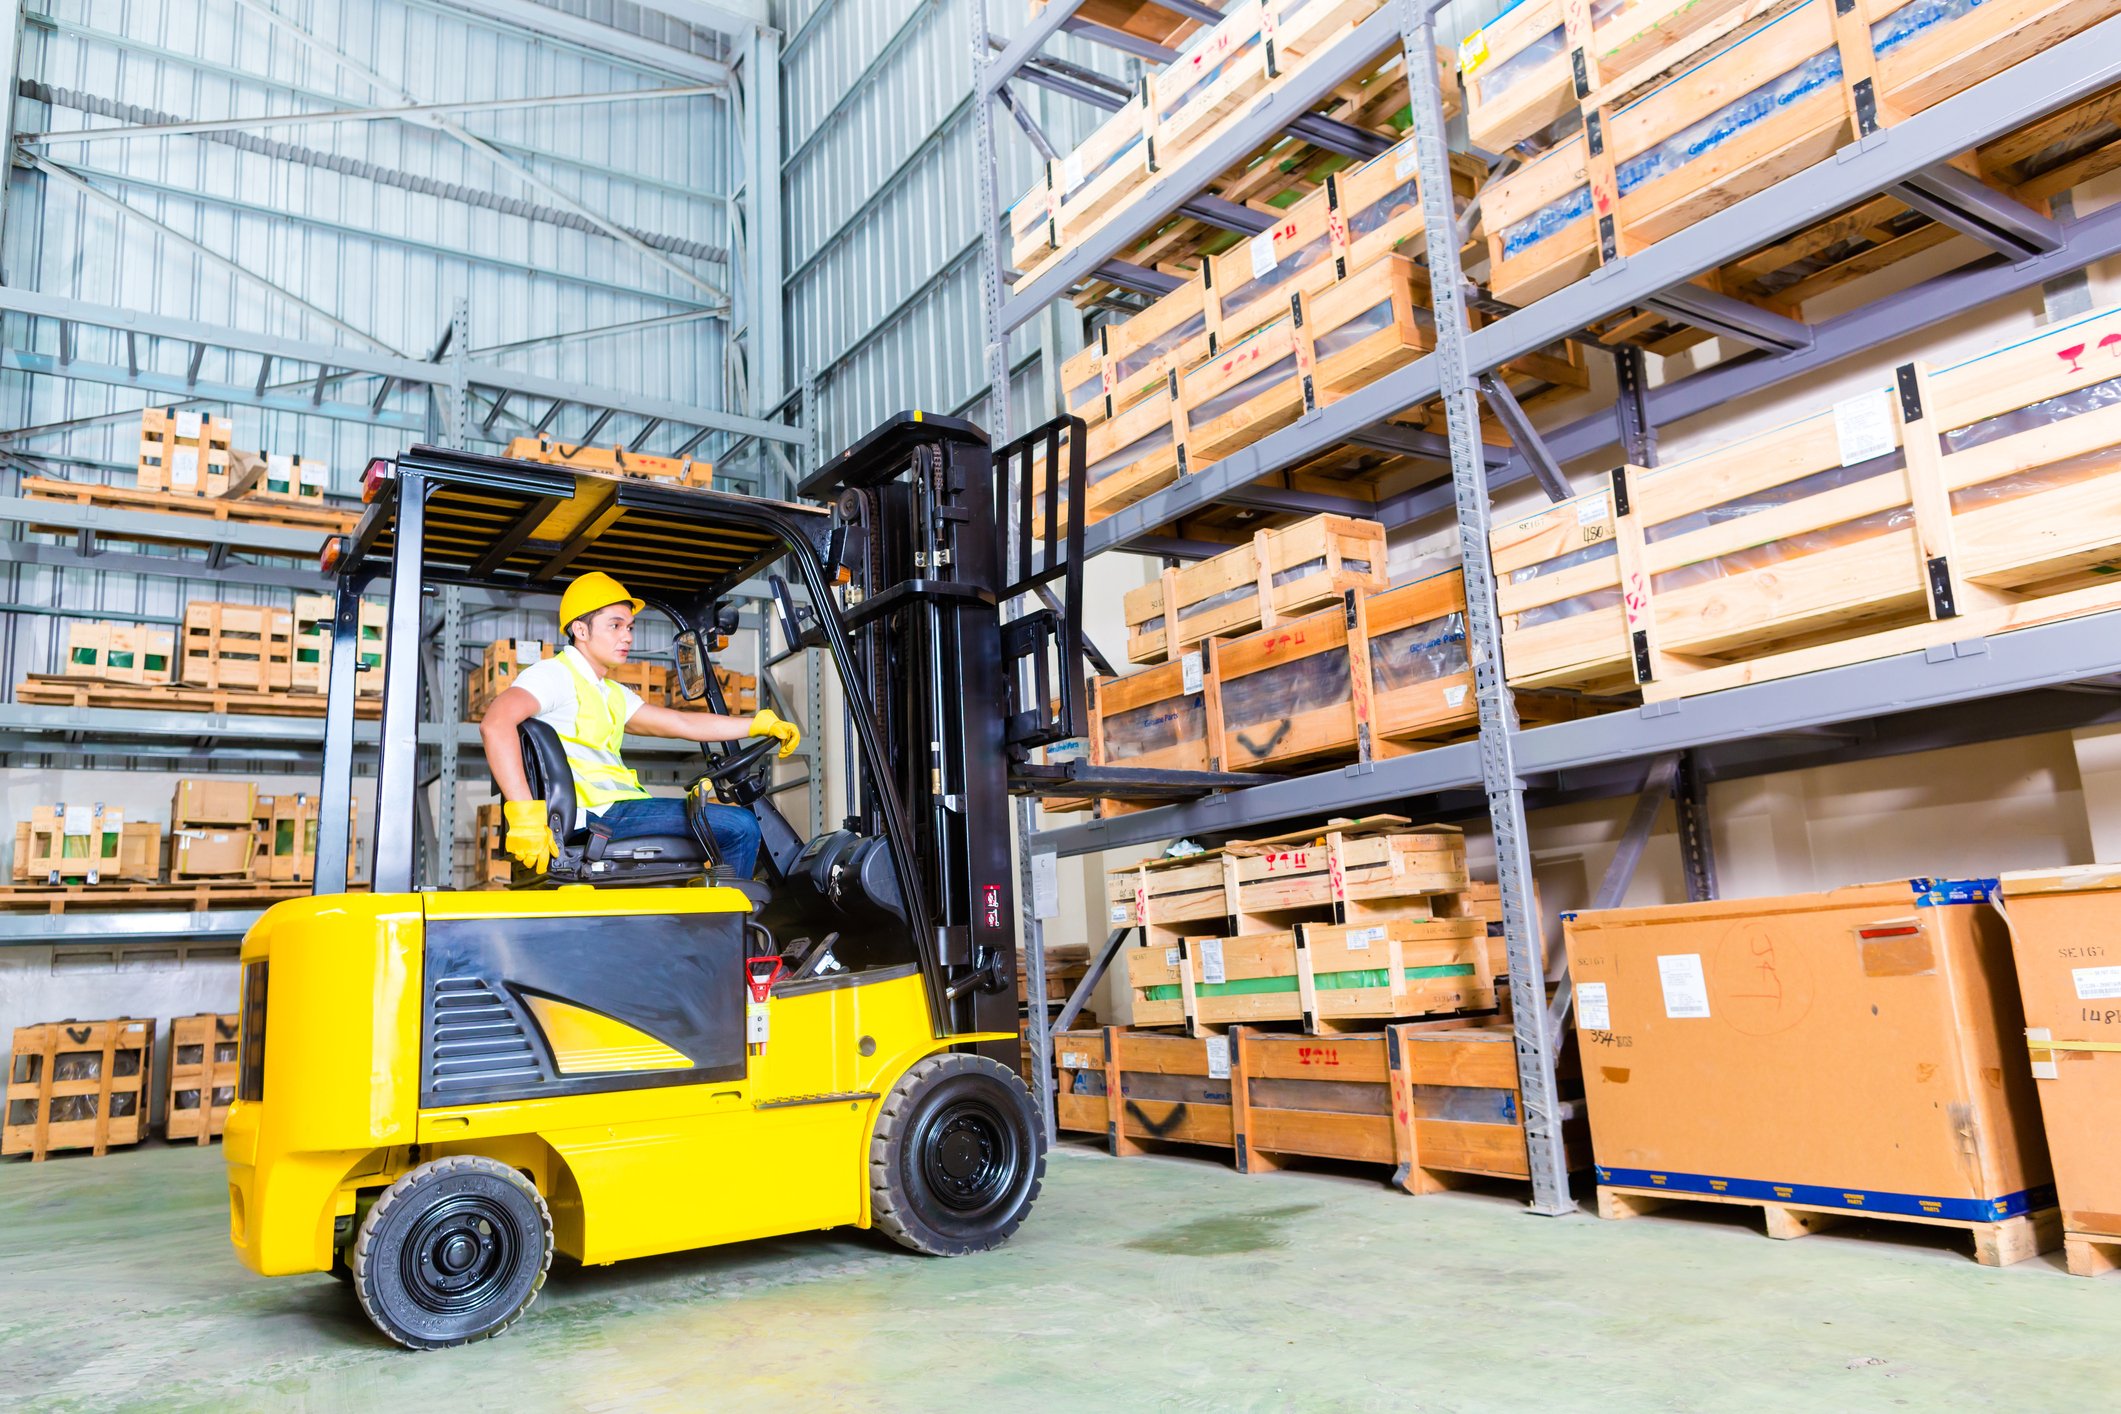
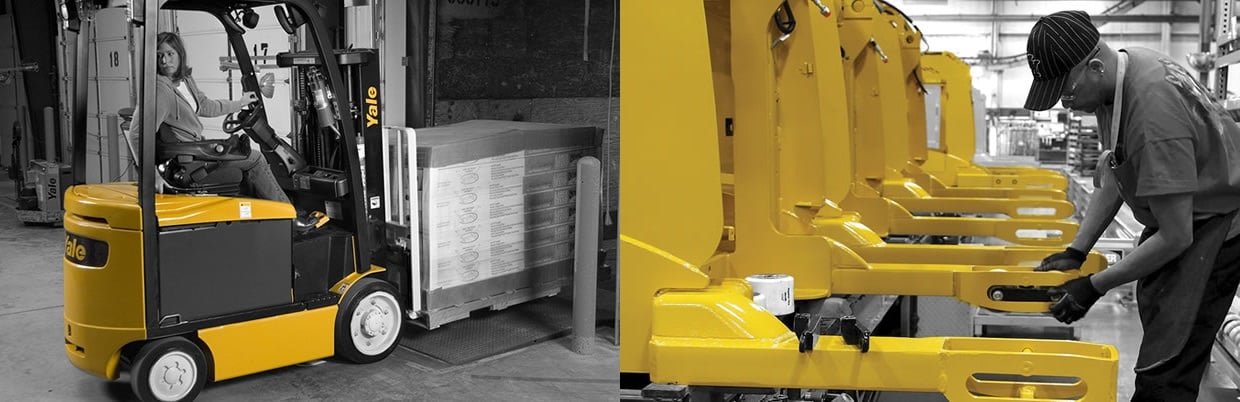
Hyster-Yale makes trucks that move heavy items in warehouses. These machines help businesses move and store goods quickly. The company also builds tools to lift specialized objects.

Trucks, Tools, and Parts

  • Lift Trucks: Global line of vehicles and solutions for moving materials sold under the Hyster and Yale brands; accounted for $755.5 million in revenue in the second quarter of 2026.
  • Attachments and Forks: Precision-engineered tools for handling delicate or specialized loads marketed under the Bolzoni brand; generated $81.9 million in revenue in the second quarter of 2026.
  • Hydrogen Solutions: Clean energy systems including hydrogen fuel-cell stacks and engines developed under the Nuvera brand name.
  • Aftermarket Parts: Replacement components and maintenance services provided to independent dealers to support fleet operations worldwide.

Shifting Gears for Growth

  • Launched a restructuring program in 2025 to reduce annual costs by $40 million to $45 million.
  • Acquired a manufacturing business in Italy in 2025 to strengthen the production capacity of the Bolzoni attachment segment.
  • Shifted certain production activities into the U.S. in 2026 to manage the financial impact of rising international tariff costs.
  • Expanded the product lineup with low-intensity trucks to meet market demand for lighter-duty and lower-priced equipment.

A Worldwide Production Network

Hyster-Yale maintains a distribution network of approximately 250 independent dealers to provide global sales and service. Its manufacturing and assembly operations are located in 10 countries to serve international markets efficiently.

The Financial Scorecard

  • Revenues were $812.9 million in the second quarter of 2026, down 15.0% year over year.
  • Operating loss was $18.4 million in the second quarter of 2026, more than doubling year over year.
  • Net loss attributable to stockholders was $31.6 million in the second quarter of 2026, more than doubling year over year.
  • Backlog reached an approximate sales value of $1.58 billion as of June 30, 2026.

Evolution Summary

Hyster-Yale has transitioned from a traditional heavy machinery maker into a provider of diverse material handling solutions. The company is currently focusing on modular product designs and manufacturing efficiency to improve its financial resilience.

AI Generated • Aug 5, 2026

Industry

Machinery

Employees

7,500

CEO

Rajiv K. Prasad, MBA

Headquarters

Cleveland, OH 44124-4069, US

HY Financials

Key Financial Metrics (TTM)

Gross Margin

15.40%

Operating Margin

-1.64%

Net Income Margin

-3.32%

Return on Equity

-25.53%

Return on Capital

2.04%

Return on Assets

-6.05%

Earnings Yield

-19.96%

Dividend Yield

4.39%

Payout Ratio

-22.11%

Stock Overview

Market Cap

$590.45MMarket cap calculated using publicly traded shares outstanding only. Does not include unlisted, private, or dual-class non-traded shares. Implied market cap may vary.

Shares Outstanding

17.93M

Volume

73.40K

Avg. Volume

98.46K

Financials (TTM)

Gross Profit

$540.60M

Operating Income

-$57.50M

EBITDA

-$15.20M

Operating Cash Flow

$77.40M

Capital Expenditure

-$62.60M

Free Cash Flow

$14.80M

Cash & ST Invst.

$72.60M

Total Debt

$500.00M

Hyster-Yale Performance Analysis

Hyster-Yale annual revenue and year-over-year revenue growth by fiscal year
Fiscal yearPeriod endRevenueYoY growth
20222022-12-31USD 3,548,300,00015.4%
20232023-12-31USD 4,118,300,00016.1%
20242024-12-31USD 4,308,200,0004.6%
20252025-12-31USD 3,769,300,000-12.5%
Hyster-Yale sequential (quarter-over-quarter) revenue growth by fiscal quarter
Fiscal quarterPeriod endQoQ growth
Q32025-09-302.4%
Q42025-12-31-5.7%
Q12026-03-31-13.9%
Q22026-06-302.2%
Hyster-Yale annual diluted earnings per share and year-over-year EPS growth by fiscal year
Fiscal yearPeriod endDiluted EPSYoY growth
20222022-12-31USD -4.38-57.4%
20232023-12-31USD 7.24N/A
20242024-12-31USD 8.0411.0%
20252025-12-31USD -3.40N/A
Hyster-Yale sequential (quarter-over-quarter) diluted earnings per share growth by fiscal quarter
Fiscal quarterPeriod endQoQ growth
Q32025-09-3083.5%
Q42025-12-31-2176.9%
Q12026-03-3142.2%
Q22026-06-30-2.9%

Revenue Growth Rate

Annual and quarterly growth comparison

Earnings Per Share Growth Rate

Annual and quarterly EPS growth comparison

Quarterly Performance

Name
Q2 2026YOY CHG

Revenue

$812.90M

-15.0%

Gross Profit

$127.60M

-22.0%

Gross Margin

15.70%

N/A

Market Cap

$590.45MMarket cap calculated using publicly traded shares outstanding only. Does not include unlisted, private, or dual-class non-traded shares. Implied market cap may vary.

N/A

Market Cap/Employee

$78.73K

N/A

Employees

7,500

N/A

Net Income

-$31.60M

-127.3%

EBITDA

$1.40M

-79.4%

Quarterly Fundamentals

Name
Q2 2026YOY CHG

Total Cash

$72.60M

+8.5%

Total Debt

$500.00M

+5.7%

Accounts Receivable

$484.80M

-5.3%

Inventory

$627.50M

-19.2%

Long Term Debt

$259.20M

+5.7%

Short Term Debt

$240.80M

+5.6%

Return on Assets

-6.05%

N/A

Return on Invested Capital

-6.19%

N/A

Free Cash Flow

$2.00M

-86.8%

Operating Cash Flow

$16.70M

-42.2%

Other Investments to Explore

People Also Watch

Symbol / CompanyPricePrice Chg
IIINInsteel Industries, Inc.
$30.95+1.94%
TWITitan International, Inc.
$7.15+7.12%
FIPFTAI Infrastructure Inc.
$3.82+2.41%
ASPNAspen Aerogels, Inc.
$5.18+1.27%

Trending Stocks

Symbol / CompanyPricePrice Chg
TSLLDirexion Shares ETF Trust - Direxion Daily Tsla Bull 2x ETF
$9.87+0.11%
BITOProShares Trust - ProShares Bitcoin ETF
$10.42+0.06%
IBITiShares Bitcoin Trust
$43.71+0.06%
MARAMara Holdings
$11.06-0.01%

Questions About HY

What is the current price of Hyster-Yale?

Hyster-Yale is trading at $34.77 per share.

What is the 52-week range for Hyster-Yale?

Over the past 52 weeks, Hyster-Yale has traded between $26.41 and $41.30.

How much debt does Hyster-Yale have?

As of the most recent reporting period, Hyster-Yale reported total debt of $500.00M.

How much cash does Hyster-Yale have on hand?

Hyster-Yale reported $72.60M in cash and cash equivalents in its most recent financial results.

What is Hyster-Yale’s dividend yield?

Hyster-Yale currently has a dividend yield of 4.39%.

Premium Investing Services

Invest better with The Motley Fool. Get stock recommendations, portfolio guidance, and more from The Motley Fool's premium services.