Accessibility Menu
Ryder System logo

Ryder System(NYSE) R

Market Cap$9.61BMarket cap calculated using publicly traded shares outstanding only. Does not include unlisted, private, or dual-class non-traded shares. Implied market cap may vary.
Since IPO (1968)+52,582%
5 Year+278%
1 Year+40%
1 Month-6%
$250.97
-3.16%
-8.18Today
After hours$250.55-$0.42 (-0.17%)
Ryder System last closing stock price
MetricPriceDate
Last closeUSD 250.542026-08-19
Ryder System stock price return by period
PeriodPrice returnPrice at period startPeriod start date
1 week-4.72%USD 262.962026-08-12
1 month-6.41%USD 267.692026-07-20
3 month+5.07%USD 238.452026-05-21
Year to date+31.99%USD 189.822025-12-31
1 year+40.11%USD 178.822025-08-19
3 year+174.39%USD 91.312023-08-18
5 year+278.13%USD 66.262021-08-20
Since inception+52,582.03%USD 0.491968-01-02

Ryder System Financials at a Glance

Market Cap

$9.61BMarket cap calculated using publicly traded shares outstanding only. Does not include unlisted, private, or dual-class non-traded shares. Implied market cap may vary.

Revenue (TTM)

$12.85B

Net Income (TTM)

$496.00M

EPS (TTM)

$12.17

P/E Ratio

20.59

Dividend

$2.73

Beta (Volatility)

1.05 (Average)

Price

$250.97

Volume

1,054.017

Open

$261.69

Previous Close

$250.54

Daily Range

$250.43 - $262.42

52-Week Range

$157.67 - $284.25

Estimated Earnings Date

Oct 22, 2026

R: Motley Fool Moneyball Superscore

73

Our CEO Is Handing Members His Secret Weapon

It's called Motley Fool Moneyball, our new proprietary AI tool

We spent over half a million dollars in R&D to build a tool that makes stock research faster, sharper, and smarter. Our analysts use it every day, and now, you can too.

Get Access Now

About Ryder System

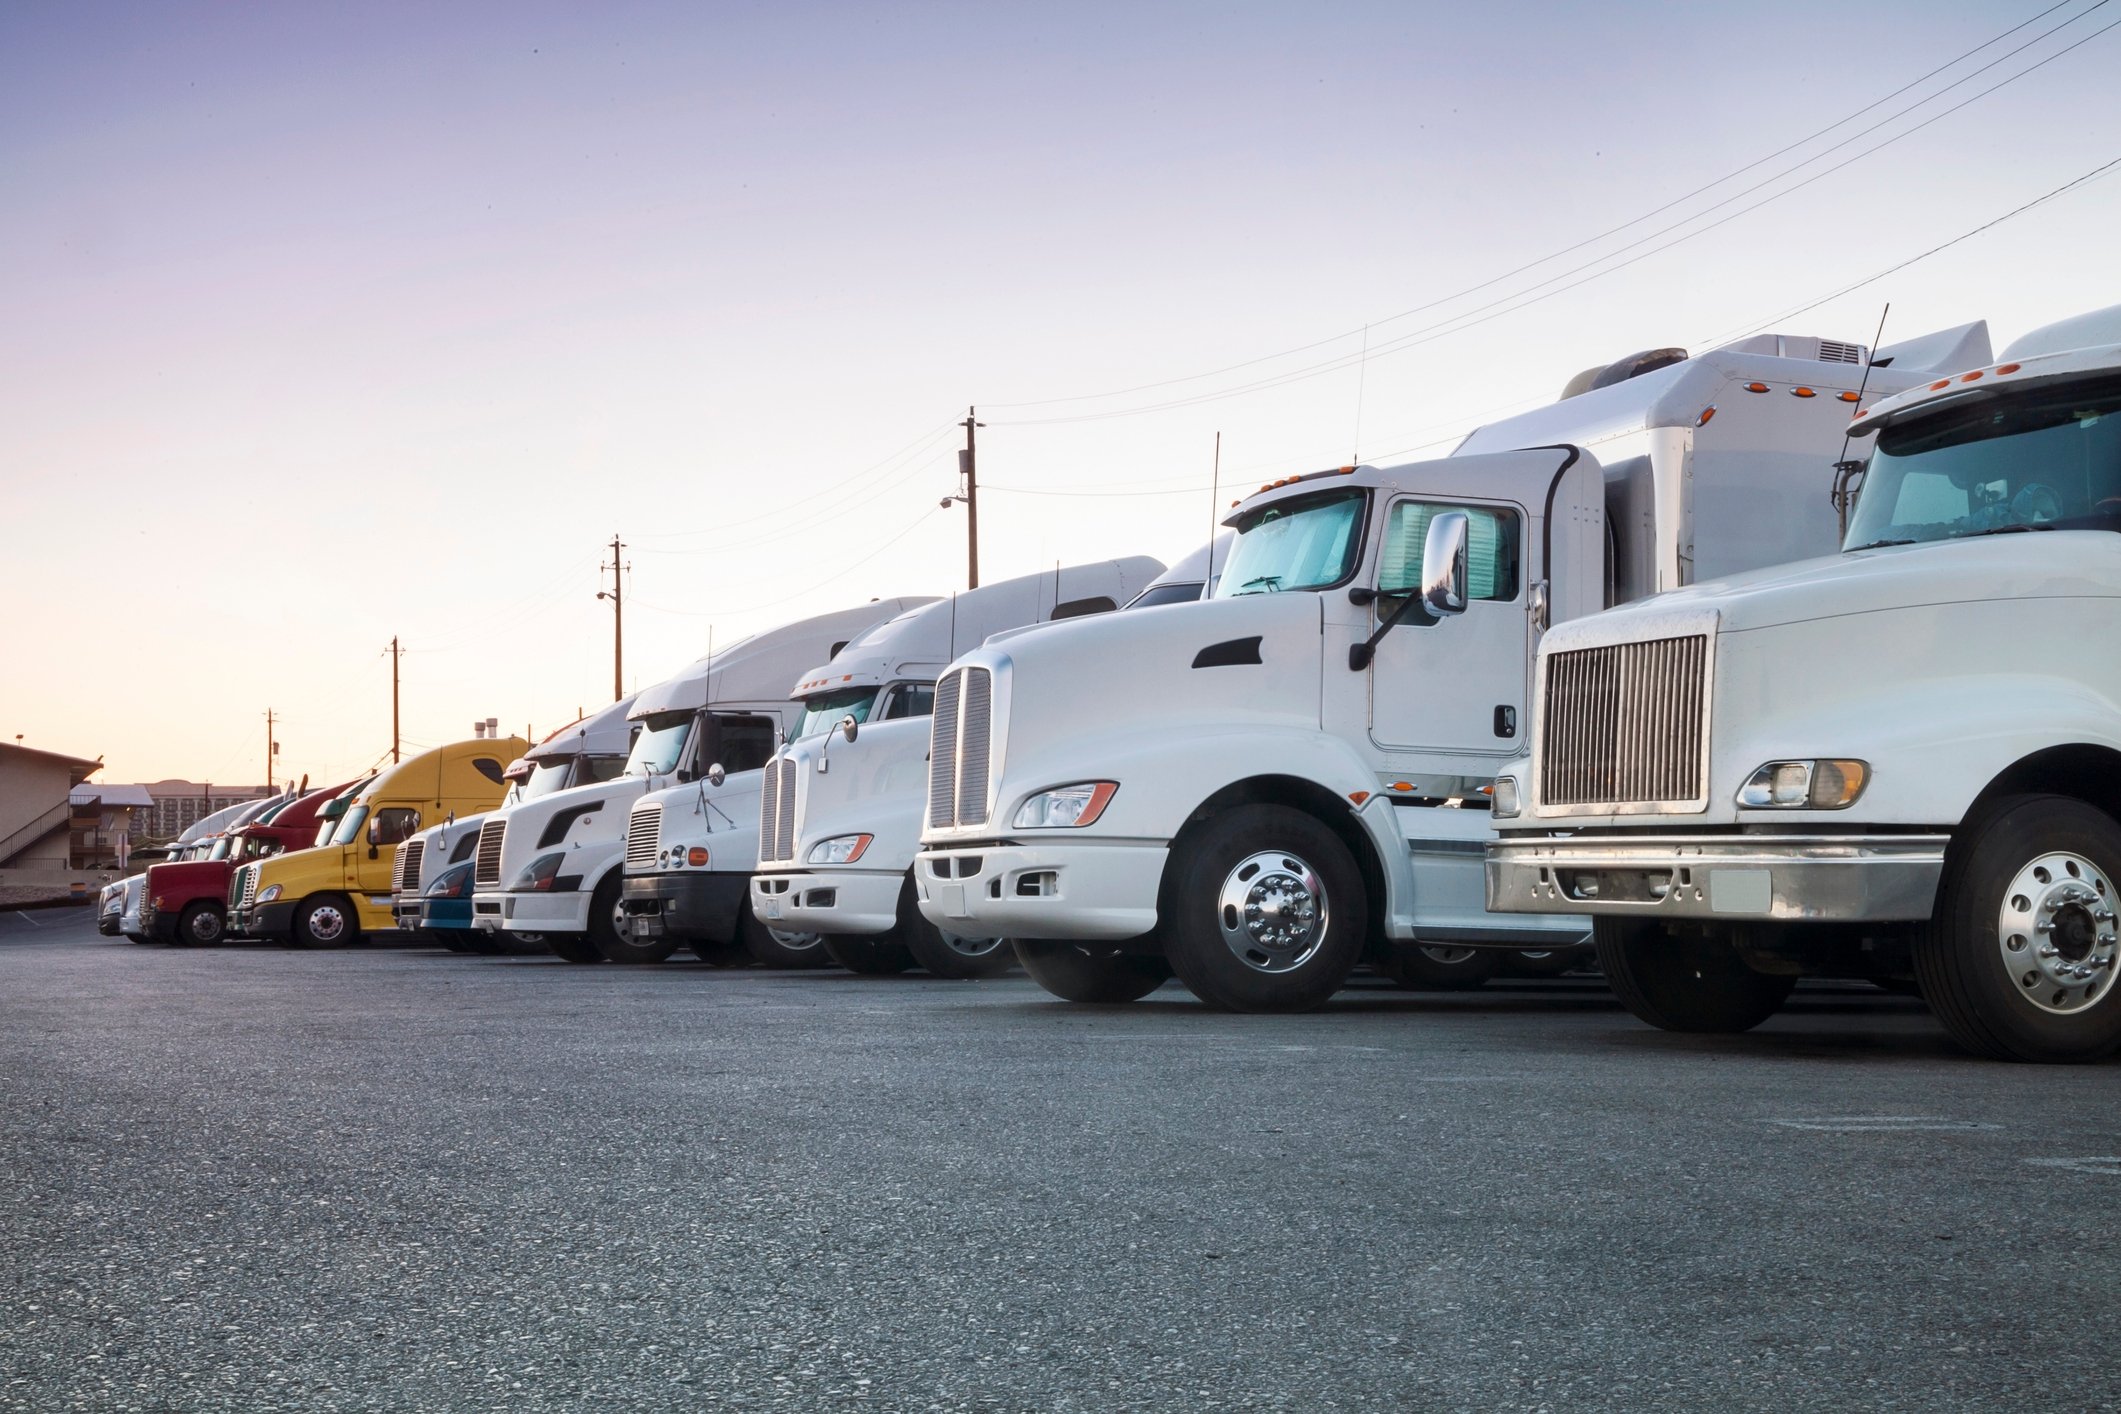
Ryder System, Inc. helps businesses move products and manage truck fleets without owning them. The company handles vehicle repairs, fuel, and finding drivers. This lets companies focus on their work while goods reach stores.

The Ryder Service Portfolio

  • Fleet Management Solutions: Provides vehicle leasing, maintenance, and commercial rentals; generated $1.6 billion in total revenue in the second quarter of 2026.
  • Supply Chain Solutions: Manages warehouse and distribution networks for industries like retail and automotive; generated $1.5 billion in total revenue in the second quarter of 2026.
  • Dedicated Transportation Solutions: Offers turnkey transportation including equipment, drivers, and routing; generated $600 million in total revenue in the second quarter of 2026.
  • Fuel Services: Supplies diesel fuel and handles tax reporting and usage monitoring for fleet customers.
  • Used Vehicle Sales: Sells pre-owned trucks and tractors through retail centers and digital platforms.

Navigating New Growth Paths

  • Extended a trade receivables financing facility in April 2026 for one year to support capital needs.
  • Right-sized the rental power fleet by 15% in the second quarter of 2026 to improve utilization levels.
  • Optimized the omnichannel retail network to drive performance within the Supply Chain Solutions segment.
  • Completed a partial settlement of the Canadian pension plan obligation in the second quarter of 2026.

Operational Strength and Strategy

Ryder uses a transformed business model that emphasizes contractual services to provide steady results across different market conditions. The company maintained an end-of-period fleet of 180,300 units as of June 30, 2026.

Key Financial Benchmarks

  • Total revenue was $3.3 billion in the second quarter of 2026, up 5% year over year.
  • Comparable earnings per share reached $3.73 in the second quarter of 2026, up 12% year over year.
  • Free cash flow hit $684 million for the six months ended June 30, 2026, up 48% year over year.
  • Gross capital expenditures were $812 million for the six months ended June 30, 2026, down 32% year over year.
  • The debt to equity ratio stood at 259% as of June 30, 2026.

A Legacy of Adaptability

Ryder has evolved from a truck leasing business into a comprehensive logistics and supply chain provider. This diversification helps the company manage market volatility while supporting long-term growth.

AI Generated • Jul 24, 2026

Industry

Road and Rail

Employees

51,600

CEO

John J. Diez, CPA

Headquarters

Coral Gables, FL 33134, US

R Financials

Key Financial Metrics (TTM)

Gross Margin

18.95%

Operating Margin

7.29%

Net Income Margin

3.86%

Return on Equity

16.70%

Return on Capital

9.44%

Return on Assets

3.08%

Earnings Yield

4.86%

Dividend Yield

1.09%

Payout Ratio

29.84%

Stock Overview

Market Cap

$9.61BMarket cap calculated using publicly traded shares outstanding only. Does not include unlisted, private, or dual-class non-traded shares. Implied market cap may vary.

Shares Outstanding

38.35M

Volume

1.05K

Avg. Volume

372.03K

Financials (TTM)

Gross Profit

$2.43B

Operating Income

$937.00M

EBITDA

$2.60B

Operating Cash Flow

$2.45B

Capital Expenditure

-$1.76B

Free Cash Flow

$687.00M

Cash & ST Invst.

$219.00M

Total Debt

$8.45B

Ryder System Performance Analysis

Ryder System annual revenue and year-over-year revenue growth by fiscal year
Fiscal yearPeriod endRevenueYoY growth
20222022-12-31USD 12,011,000,00024.3%
20232023-12-31USD 11,783,000,000-1.9%
20242024-12-31USD 12,636,000,0007.2%
20252025-12-31USD 12,665,000,0000.2%
Ryder System sequential (quarter-over-quarter) revenue growth by fiscal quarter
Fiscal quarterPeriod endQoQ growth
Q32025-09-30-0.4%
Q42025-12-310.4%
Q12026-03-31-1.5%
Q22026-06-306.7%
Ryder System annual diluted earnings per share and year-over-year EPS growth by fiscal year
Fiscal yearPeriod endDiluted EPSYoY growth
20222022-12-31USD 16.9475.5%
20232023-12-31USD 8.73-48.4%
20242024-12-31USD 11.0526.6%
20252025-12-31USD 11.877.3%
Ryder System sequential (quarter-over-quarter) diluted earnings per share growth by fiscal quarter
Fiscal quarterPeriod endQoQ growth
Q32025-09-307.1%
Q42025-12-31-2.4%
Q12026-03-31-28.0%
Q22026-06-3045.3%

Revenue Growth Rate

Annual and quarterly growth comparison

Earnings Per Share Growth Rate

Annual and quarterly EPS growth comparison

Quarterly Performance

Name
Q2 2026YOY CHG

Revenue

$3.35B

+5.0%

Gross Profit

$523.00M

-20.8%

Gross Margin

15.63%

N/A

Market Cap

$9.61BMarket cap calculated using publicly traded shares outstanding only. Does not include unlisted, private, or dual-class non-traded shares. Implied market cap may vary.

N/A

Market Cap/Employee

$186.19K

N/A

Employees

51,600

N/A

Net Income

$133.00M

+1.5%

EBITDA

$133.00M

-84.2%

Quarterly Fundamentals

Name
Q2 2026YOY CHG

Total Cash

$219.00M

+21.7%

Total Debt

$8.45B

-3.1%

Accounts Receivable

$2.00B

+7.8%

Inventory

$0.00

N/A

Long Term Debt

$6.19B

-19.5%

Short Term Debt

$2.26B

+120.4%

Return on Assets

3.08%

N/A

Return on Invested Capital

7.72%

N/A

Free Cash Flow

$272.00M

+331.7%

Operating Cash Flow

$677.00M

-10.0%

Other Investments to Explore

People Also Watch

Symbol / CompanyPricePrice Chg
TTCThe Toro Company
$97.43+1.10%
MSAMSA Safety Incorporated
$189.43+0.03%
ALAir Lease Corporation
$65.00+0.00%
GATXGATX Corporation
$176.16-1.21%

Trending Stocks

Symbol / CompanyPricePrice Chg
WBSWebster Financial
$77.57-0.01%
IBITiShares Bitcoin Trust
$38.78+0.06%
MRNAModerna
$174.38+1.77%
SOXSDirexion Shares ETF Trust - Direxion Daily Semiconductor Bear 3x ETF
$47.05+0.06%

Questions About R

What is the current price of Ryder System?

Ryder System is trading at $250.54 per share.

What is the 52-week range for Ryder System?

Over the past 52 weeks, Ryder System has traded between $157.67 and $284.25.

How much debt does Ryder System have?

As of the most recent reporting period, Ryder System reported total debt of $8.45B.

How much cash does Ryder System have on hand?

Ryder System reported $219.00M in cash and cash equivalents in its most recent financial results.

What is Ryder System’s dividend yield?

Ryder System currently has a dividend yield of 1.09%.

Premium Investing Services

Invest better with The Motley Fool. Get stock recommendations, portfolio guidance, and more from The Motley Fool's premium services.