Accessibility Menu
Vulcan Materials logo

Vulcan Materials(NYSE) VMC

Current Price$280.22
Market Cap$35.67BMarket cap calculated using publicly traded shares outstanding only. Does not include unlisted, private, or dual-class non-traded shares. Implied market cap may vary.
Since IPO (1968)+142,273%
5 Year+61%
1 Year+3%
1 Month-8%
Vulcan Materials last closing stock price
MetricPriceDate
Last closeUSD 274.932026-07-23
Vulcan Materials stock price return by period
PeriodPrice returnPrice at period startPeriod start date
1 week-6.32%USD 293.472026-07-16
1 month-8.08%USD 299.092026-06-23
3 month-5.68%USD 291.492026-04-24
Year to date-3.23%USD 284.122025-12-31
1 year+2.91%USD 267.172025-07-23
3 year+26.3%USD 217.682023-07-24
5 year+60.62%USD 171.172021-07-23
Since inception+142,272.51%USD 0.191968-01-02

Vulcan Materials Financials at a Glance

Market Cap

$35.67BMarket cap calculated using publicly traded shares outstanding only. Does not include unlisted, private, or dual-class non-traded shares. Implied market cap may vary.

Revenue (TTM)

$8.05B

Net Income (TTM)

$1.12B

EPS (TTM)

$8.40

P/E Ratio

32.71

Dividend

$2.02

Beta (Volatility)

0.93 (Low)

Price

$280.22

Volume

797,923

Open

$275.58

Previous Close

$279.70

Daily Range

$274.44 - $280.79

52-Week Range

$252.35 - $331.09

Estimated Earnings Date

Jul 29, 2026

VMC: Motley Fool Moneyball Superscore

72

Our CEO Is Handing Members His Secret Weapon

It's called Motley Fool Moneyball, our new proprietary AI tool

We spent over half a million dollars in R&D to build a tool that makes stock research faster, sharper, and smarter. Our analysts use it every day, and now, you can too.

Get Access Now

About Vulcan Materials

Vulcan Materials makes the basic materials used to build our world. They help builders create homes, offices, and roads with stone and gravel. These products provide the foundation for essential bridges, airports, and water systems.

What They Make

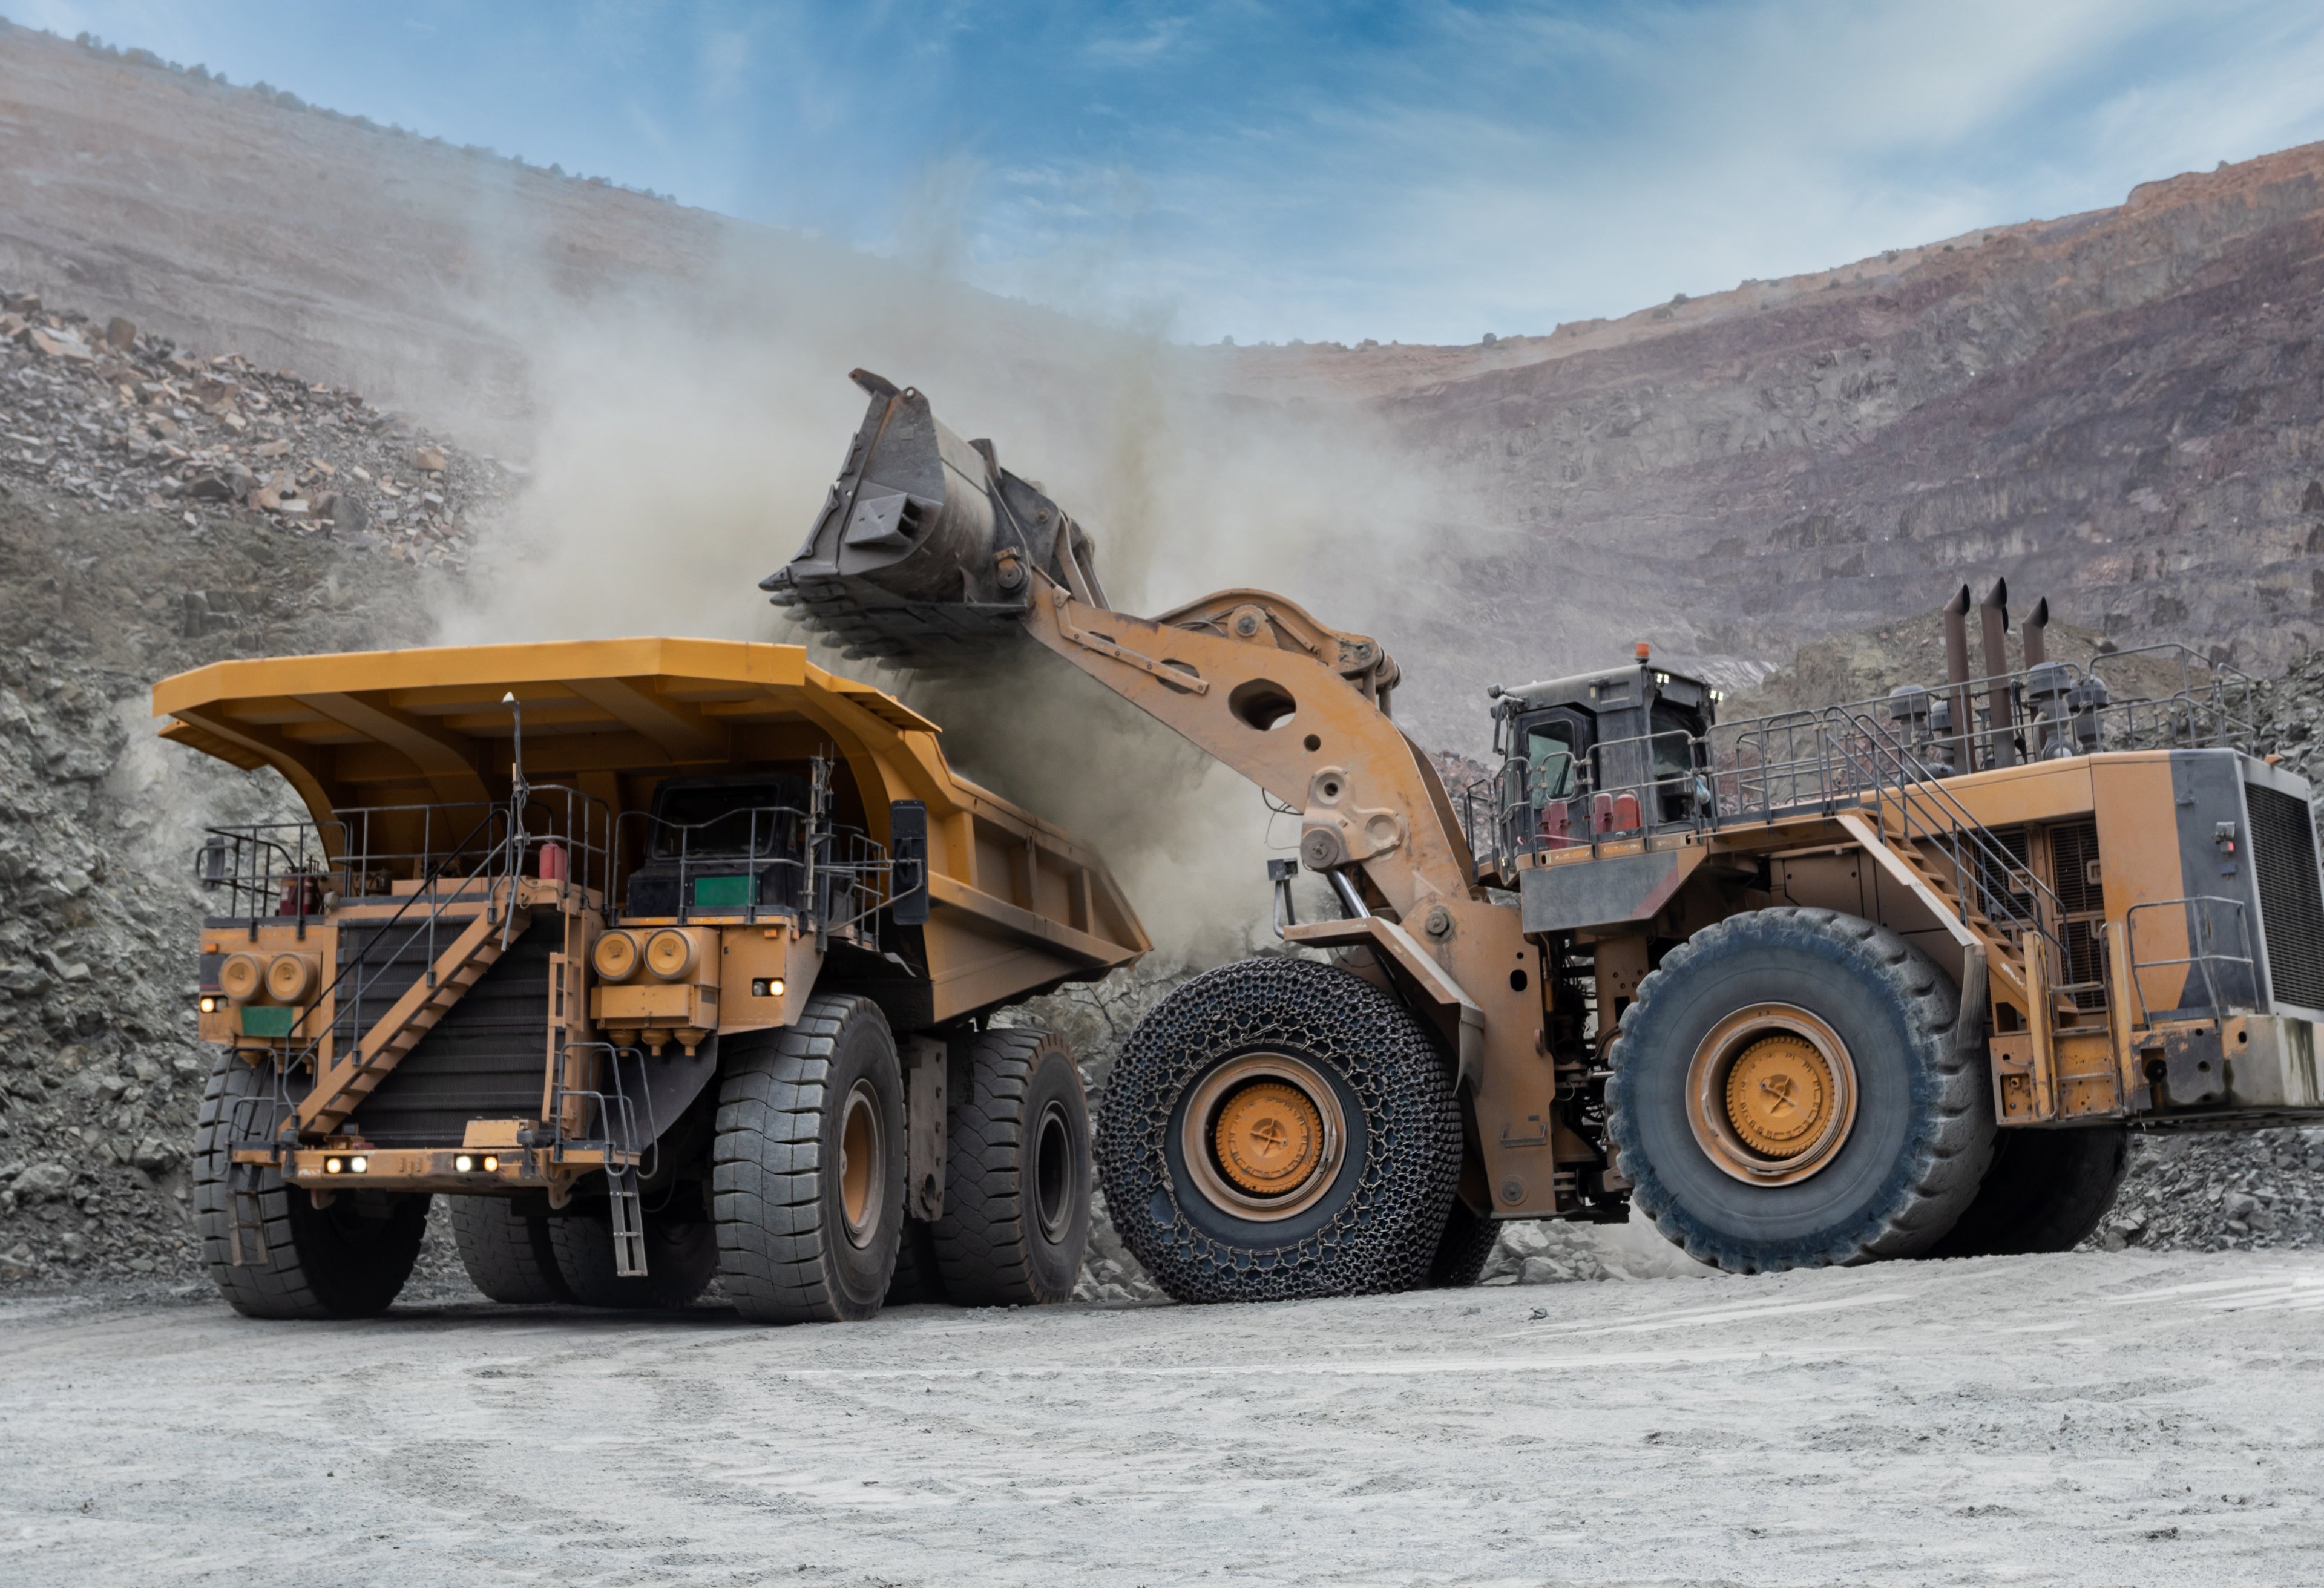
  • Aggregates: Crushed stone, sand, and gravel used for foundations and infrastructure; represents 73% of 2025 gross profit.
  • Asphalt: Sticky, black paving material used for highways and streets in six states; accounts for 16% of 2025 gross profit.
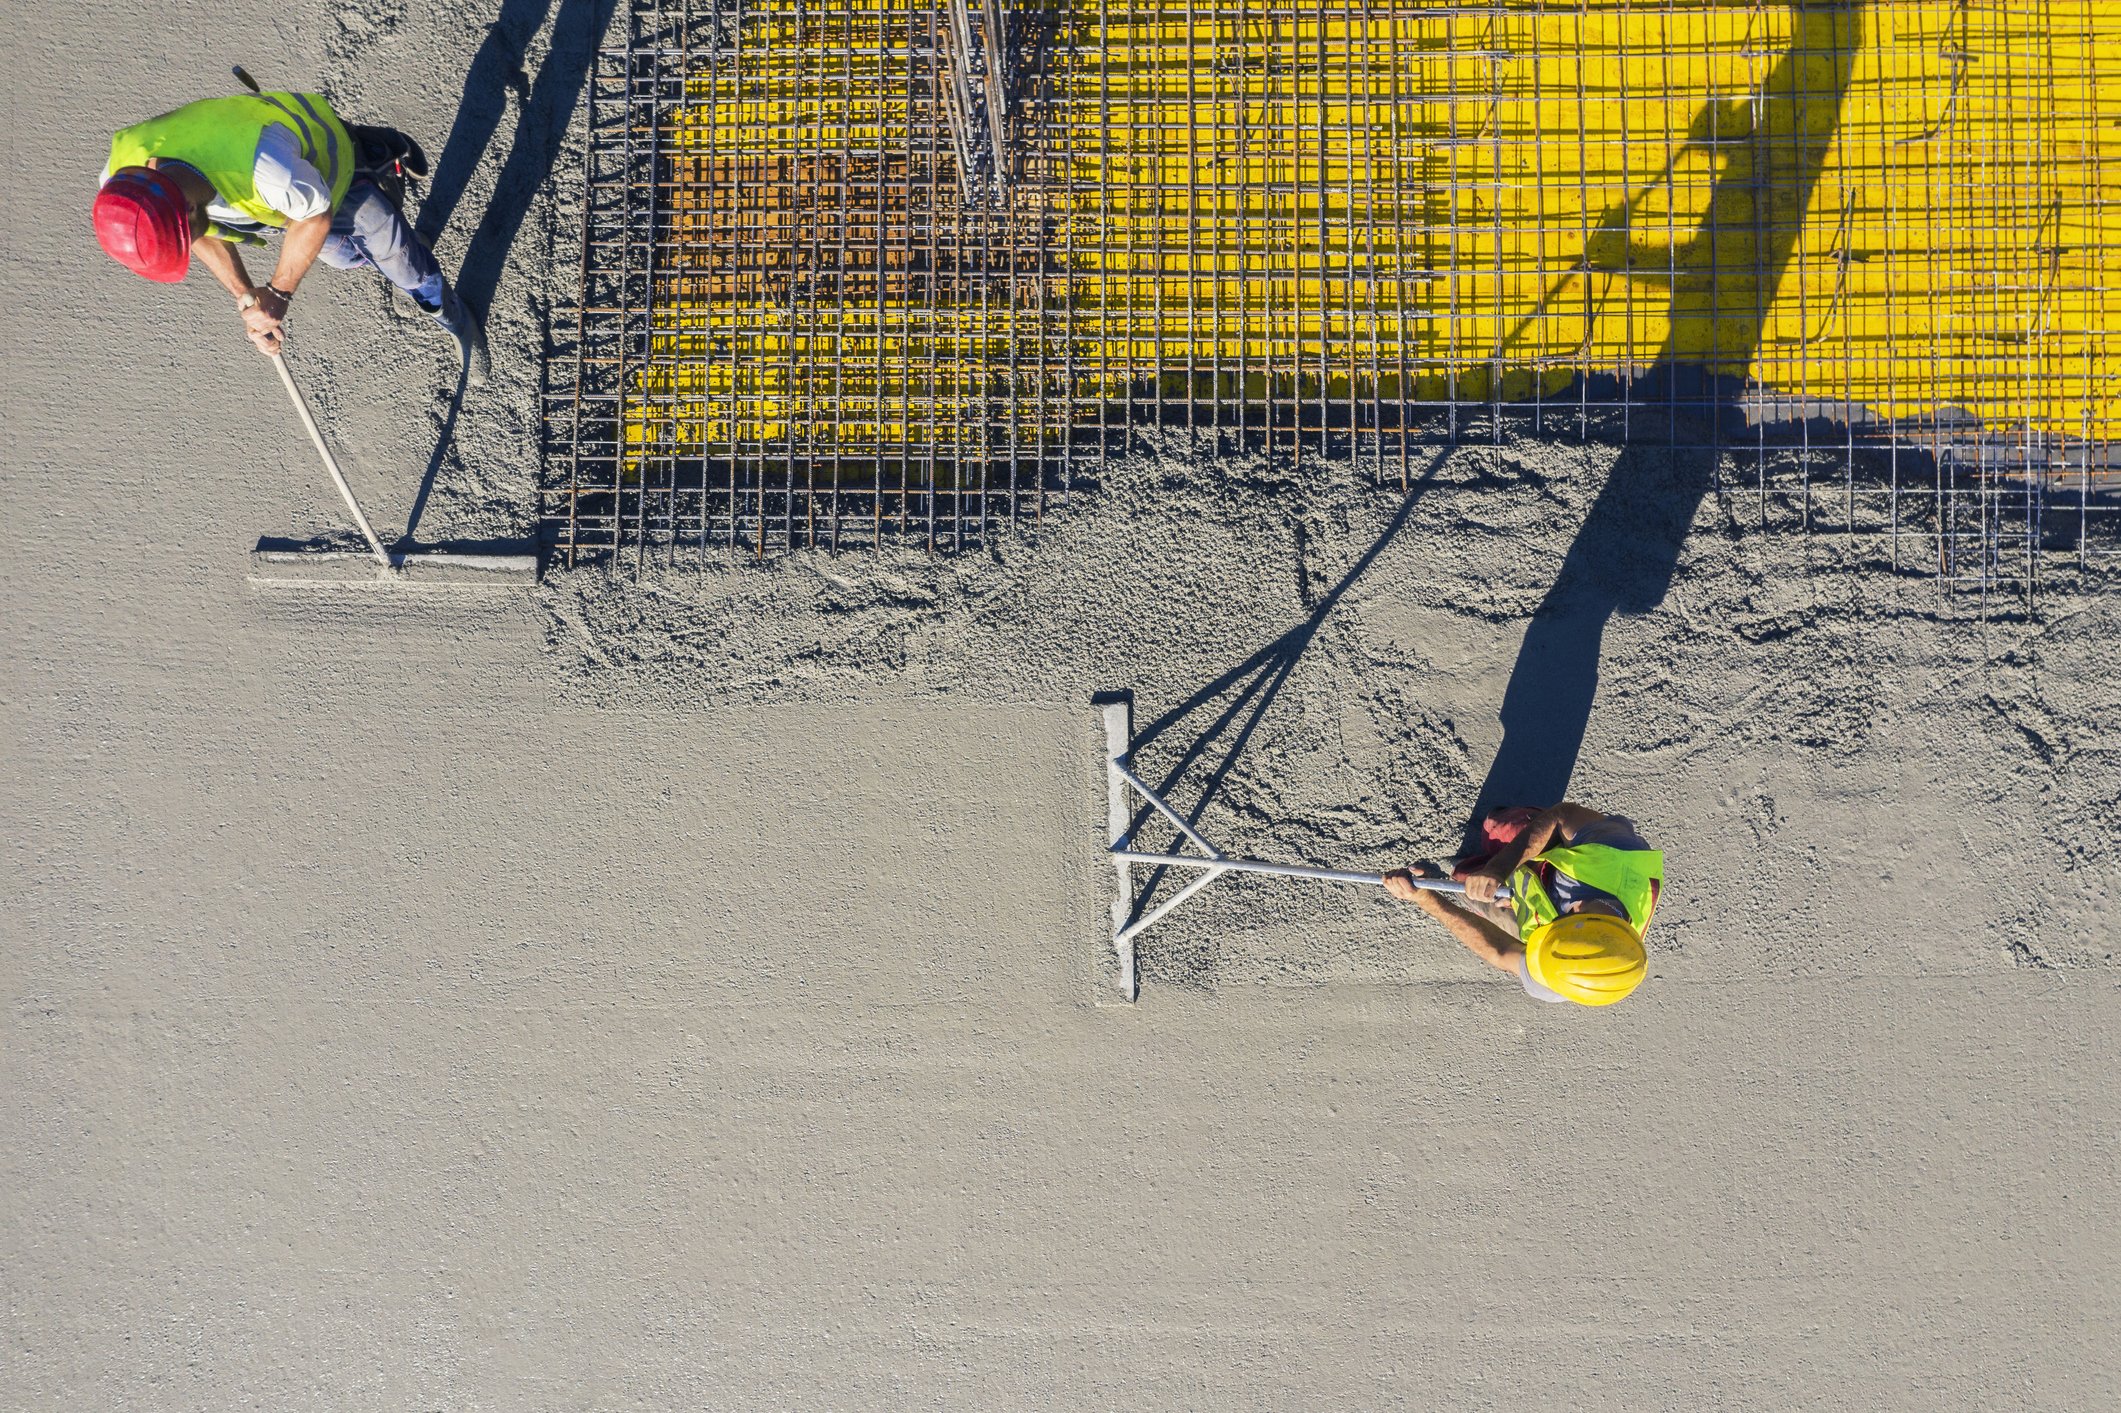
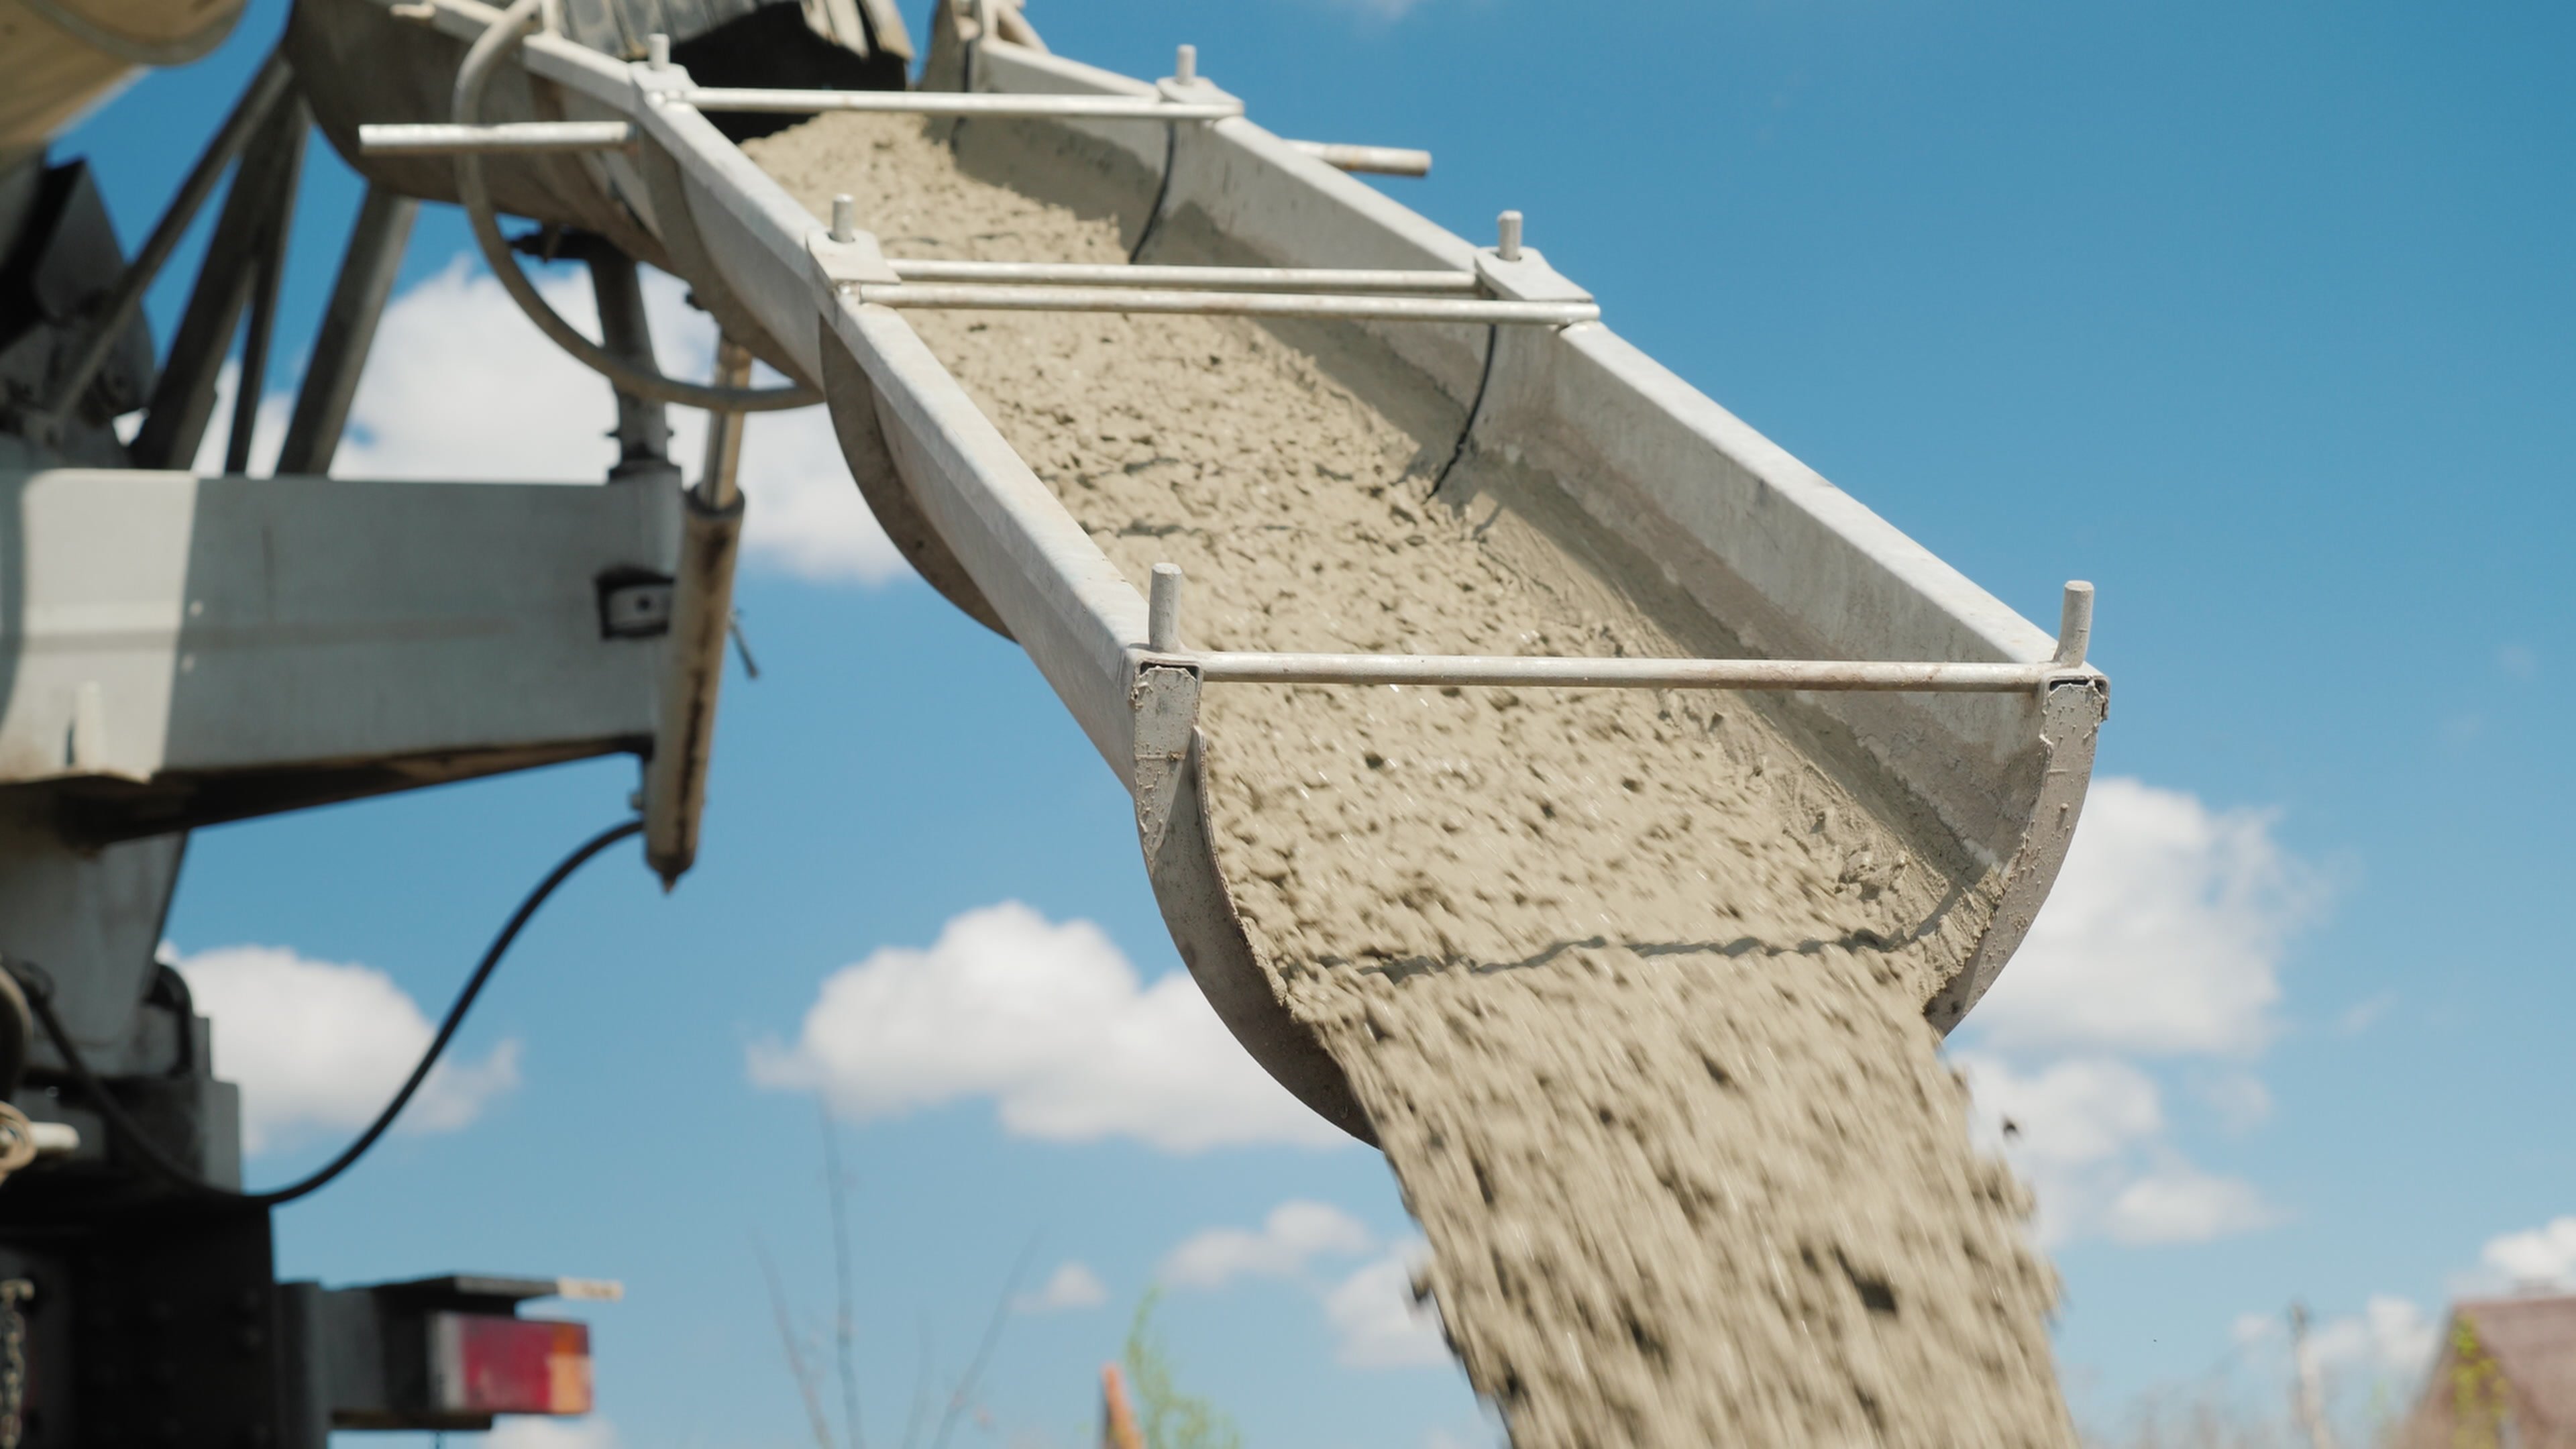
  • Concrete: Liquid building material that hardens into structures like buildings and sidewalks; comprises 11% of 2025 gross profit.
  • Calcium: Special minerals mined for use in animal feed, plastics, and water treatment.

Recent Growth and Moves

  • Expanded the asphalt business in California during 2024 by acquiring several local operations.
  • Strengthened the core aggregates network by completing over 30 acquisitions of quarries and sales yards in the last 10 years.
  • Sold the Houston asphalt and paving business in 2025 to focus on higher-growth areas.
  • Reached an agreement to sell the California concrete business in late 2025 to simplify operations.
  • Acquired U.S. Concrete in 2021 to grow the company's footprint in major metropolitan areas.

What Makes Them Different

The company manages 16.6 billion tons of stone and gravel reserves located near fast-growing cities. These materials are heavy and expensive to move, so owning local quarries creates a significant advantage over distant competitors.

The Financial Scorecard

  • Total revenue reached $1.9 billion in Q4 2025, up 3.2% from $1.9 billion in Q4 2024.
  • Net income was $252 million in Q4 2025, a decrease of 14.2% compared to Q4 2024.
  • Operating cash flow rose to $543 million in Q4 2025, up 23.4% year-over-year.
  • Free cash flow hit $358.2 million in Q4 2025, up 29% from Q4 2024.

The Bottom Line

Vulcan has transitioned from a local mining business into the largest aggregates supplier in the United States. Its focus on stone and gravel provides a steady foundation while it adjusts its concrete and asphalt holdings to match market demand.

AI Generated • Apr 18, 2026

Industry

Construction Materials

Sector

Materials

Employees

11,548

CEO

Ronnie A. Pruitt

Headquarters

Birmingham, AL 35242-5014, US

VMC Financials

Key Financial Metrics (TTM)

Gross Margin

27.61%

Operating Margin

20.62%

Net Income Margin

13.88%

Return on Equity

13.10%

Return on Capital

11.42%

Return on Assets

6.70%

Earnings Yield

3.06%

Dividend Yield

0.73%

Payout Ratio

23.42%

Stock Overview

Market Cap

$35.67BMarket cap calculated using publicly traded shares outstanding only. Does not include unlisted, private, or dual-class non-traded shares. Implied market cap may vary.

Shares Outstanding

129.75M

Volume

797.92K

Avg. Volume

1.16M

Financials (TTM)

Gross Profit

$2.22B

Operating Income

$1.66B

EBITDA

$2.59B

Operating Cash Flow

$1.80B

Capital Expenditure

-$686.20M

Free Cash Flow

$1.12B

Cash & ST Invst.

$140.20M

Total Debt

$5.09B

Vulcan Materials Performance Analysis

Vulcan Materials annual revenue and year-over-year revenue growth by fiscal year
Fiscal yearPeriod endRevenueYoY growth
20222022-12-31USD 7,315,200,00031.8%
20232023-12-31USD 7,781,900,0006.4%
20242024-12-31USD 7,417,700,000-4.7%
20252025-12-31USD 7,941,100,0007.1%
Vulcan Materials sequential (quarter-over-quarter) revenue growth by fiscal quarter
Fiscal quarterPeriod endQoQ growth
Q22025-06-3028.6%
Q32025-09-308.6%
Q42025-12-31-16.2%
Q12026-03-31-8.2%
Vulcan Materials annual diluted earnings per share and year-over-year EPS growth by fiscal year
Fiscal yearPeriod endDiluted EPSYoY growth
20222022-12-31USD 4.31-14.3%
20232023-12-31USD 6.9862.0%
20242024-12-31USD 6.85-1.8%
20252025-12-31USD 8.1118.4%
Vulcan Materials sequential (quarter-over-quarter) diluted earnings per share growth by fiscal quarter
Fiscal quarterPeriod endQoQ growth
Q22025-06-30148.5%
Q32025-09-3017.4%
Q42025-12-31-32.5%
Q12026-03-31-34.0%

Revenue Growth Rate

Annual and quarterly growth comparison

Earnings Per Share Growth Rate

Annual and quarterly EPS growth comparison

Quarterly Performance

Name
Q1 2026YOY CHG

Revenue

$1.76B

+7.4%

Gross Profit

$422.70M

+15.7%

Gross Margin

24.07%

N/A

Market Cap

$35.67BMarket cap calculated using publicly traded shares outstanding only. Does not include unlisted, private, or dual-class non-traded shares. Implied market cap may vary.

N/A

Market Cap/Employee

$3.09M

N/A

Employees

11,548

N/A

Net Income

$165.50M

+28.4%

EBITDA

$436.50M

+6.4%

Quarterly Fundamentals

Name
Q1 2026YOY CHG

Total Cash

$140.20M

-22.7%

Total Debt

$5.09B

-6.9%

Accounts Receivable

$975.70M

+5.0%

Inventory

$695.80M

-3.5%

Long Term Debt

$4.89B

-10.5%

Short Term Debt

$197.00M

+39300.0%

Return on Assets

6.70%

N/A

Return on Invested Capital

10.60%

N/A

Free Cash Flow

$64.60M

-22.6%

Operating Cash Flow

$241.10M

-4.1%

Other Investments to Explore

People Also Watch

Symbol / CompanyPricePrice Chg
MLMMartin Marietta Materials, Inc.
$559.60+2.33%
AUAngloGold Ashanti plc
$79.67+1.59%
FNVFranco-Nevada Corporation
$214.68+0.21%
GFIGold Fields Limited
$32.70+1.30%

Trending Stocks

Symbol / CompanyPricePrice Chg
NOKNokia
$9.10-0.06%
TSLLDirexion Shares ETF Trust - Direxion Daily Tsla Bull 2x Shares
$7.42-0.04%
ONDSOndas
$7.80-0.02%
AALAmerican Airlines Group
$14.48+0.07%

Questions About VMC

What is the current price of Vulcan Materials?

Vulcan Materials is trading at $279.70 per share.

What is the 52-week range for Vulcan Materials?

Over the past 52 weeks, Vulcan Materials has traded between $252.35 and $331.09.

How much debt does Vulcan Materials have?

As of the most recent reporting period, Vulcan Materials reported total debt of $5.14B.

How much cash does Vulcan Materials have on hand?

Vulcan Materials reported $143.70M in cash and cash equivalents in its most recent financial results.

What is Vulcan Materials’s dividend yield?

Vulcan Materials currently has a dividend yield of 0.73%.

Premium Investing Services

Invest better with The Motley Fool. Get stock recommendations, portfolio guidance, and more from The Motley Fool's premium services.